 2022eampleforQ1

《2022eampleforQ1》由会员分享,可在线阅读,更多相关《2022eampleforQ1(9页珍藏版)》请在装配图网上搜索。
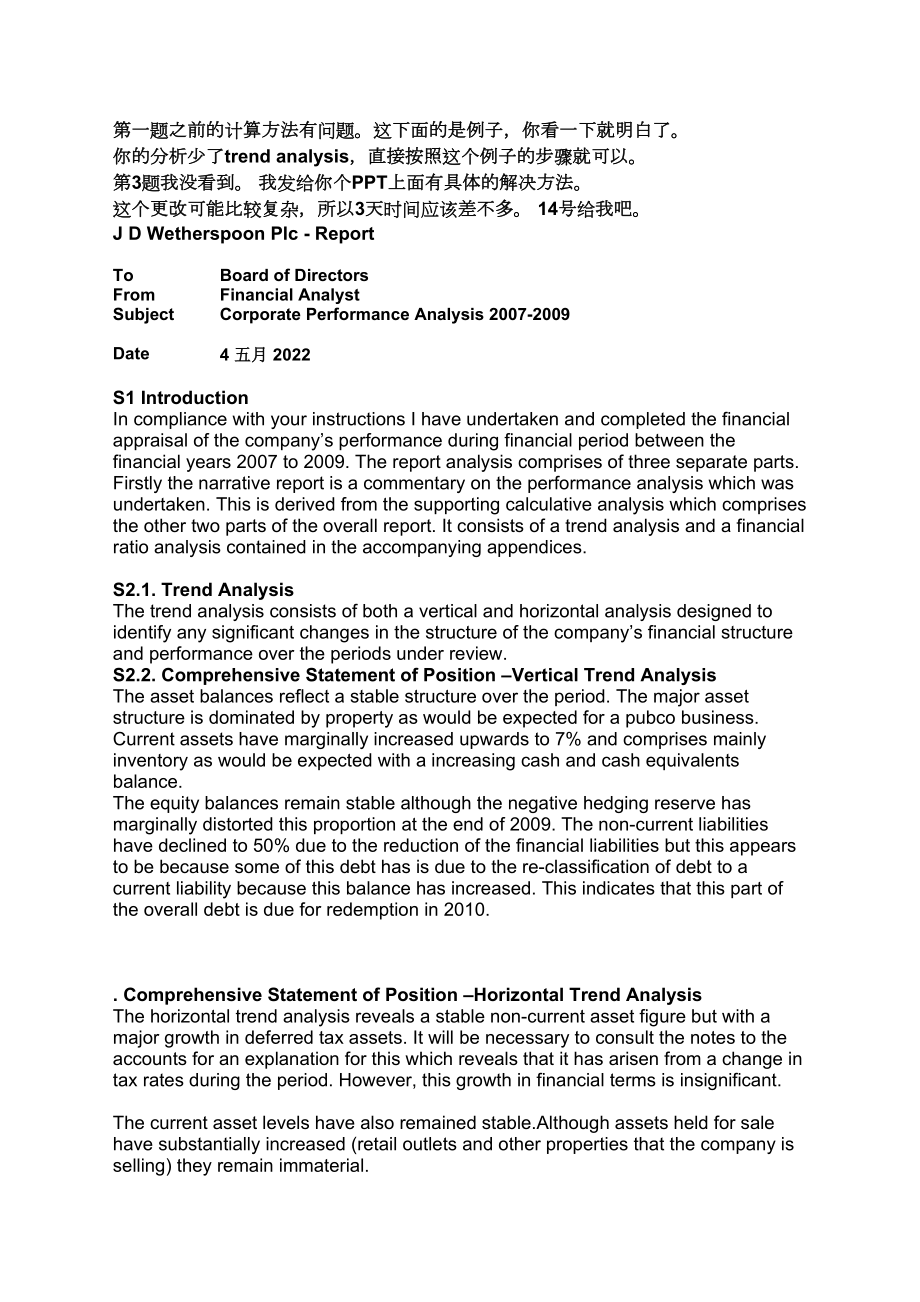
1、第一题之前的计算方法有问题。这下面的是例子,你看一下就明白了。 你的分析少了trend analysis,直接按照这个例子的步骤就可以。第3题我没看到。 我发给你个PPT上面有具体的解决方法。 这个更改可能比较复杂,所以3天时间应该差不多。 14号给我吧。J D Wetherspoon Plc - ReportToBoard of DirectorsFromFinancial AnalystSubjectCorporate Performance Analysis 2007-2009Date4 五月 2022S1 IntroductionIn compliance with your inst
2、ructions I have undertaken and completed the financial appraisal of the companys performance during financial period between the financial years 2007 to 2009. The report analysis comprises of three separate parts. Firstly the narrative report is a commentary on the performance analysis which was und
3、ertaken. This is derived from the supporting calculative analysis which comprises the other two parts of the overall report. It consists of a trend analysis and a financial ratio analysis contained in the accompanying appendices. S2.1. Trend AnalysisThe trend analysis consists of both a vertical and
4、 horizontal analysis designed to identify any significant changes in the structure of the companys financial structure and performance over the periods under review.S2.2. Comprehensive Statement of Position Vertical Trend AnalysisThe asset balances reflect a stable structure over the period. The maj
5、or asset structure is dominated by property as would be expected for a pubco business.Current assets have marginally increased upwards to 7% and comprises mainly inventory as would be expected with a increasing cash and cash equivalents balance. The equity balances remain stable although the negativ
6、e hedging reserve has marginally distorted this proportion at the end of 2009. The non-current liabilities have declined to 50% due to the reduction of the financial liabilities but this appears to be because some of this debt has is due to the re-classification of debt to a current liability becaus
7、e this balance has increased. This indicates that this part of the overall debt is due for redemption in 2010. Comprehensive Statement of Position Horizontal Trend AnalysisThe horizontal trend analysis reveals a stable non-current asset figure but with a major growth in deferred tax assets. It will
8、be necessary to consult the notes to the accounts for an explanation for this which reveals that it has arisen from a change in tax rates during the period. However, this growth in financial terms is insignificant.The current asset levels have also remained stable.Although assets held for sale have
9、substantially increased (retail outlets and other properties that the company is selling) they remain immaterial.Shareholders equity has remained stable revealing no major capital financing has occurred. The item to note although it is not financially significant is the losses taken to the hedging r
10、eserve. Again reference to the notes to the accounts is needed for a detailedexplanation. The losses have arisen from revaluations of the companys financial instrument holdings which have had major falls in value due to the “credit crunch” financial recession.Non- current liabilities overall have de
11、clined particularly financial liabilities which, have fallen over the periods although there has been a rise in derivative balances a type of financial instrument but these are insignificant in financial terms.Current liabilities on the other hand have increased. The major area of growth is in short
12、-term financial liabilities. Again further investigation is required by reference to the notes to the accounts for an explanation. This discloses that the major rise is in an American bank loan of 86.7 million. This is probably part of a long term loan that is now repayable within the next year, i.e
13、. the part of a long-term loan which has now had to be re-classified as a current loan because of its impending repayment. The other increase is in the payables balances but this is also reflected in increasing receivables and cash balances which indicate less efficient credit control.Overall the co
14、mprehensive statement of position analysis reflects no overall significant structural changes.S3.1 Vertical and Horizontal Trend Analysis Commentary: Statement of Comprehensive IncomeThe companys revenues are growing demonstrating an expanding market but these are being marginally eroded by the rise
15、 in the cost of sales. Although a growth in operating expenses occurred during 2008 this has been reduced so that the decline in operating profits has been redressed by management and this remains stable.Finance costs have been brought back to the baseline year levels although tax levels have increa
16、sed but this may beyond the control of the company with the imposition of increased government alcohol duties.Reported profits in 2009 and 2008 have been substantially affected by exceptional charges but the underlying trend is one of recovering profitability after a period of recession notably in 2
17、008 due the impacts of the wider economic recessionS4 .1 Financial Ratio Analysis -ProfitabilityThe ROCE is improving as the company is utilising its capital more efficiently. The most recent results have been adversely affected by the exceptional charges suffered but the underlying trend is that of
18、 an improving ROCE. The return on assets indicates a more effective use of the asset base to generate profits although this is marginal and is partly due a rationalisation of the non-current property assets.The gross margin remains stable as revenues and purchases appear to be increasing in parallel
19、 indicating these costs are being passed on to its customers. The net profit margin is recovering from the adverse trading conditions of 2008 and the trend indicates that it will recover and probably surpass the 2007 performance level.S4 .2 Financial Ratio Analysis - EfficiencyTrade receivables are
20、increasing but are substantially less than the payables which are also increasing indicating a very favourable positive cash flow, i.e. funds are received about 58 days before being paid out. However, care must be exercised to avoid alienating suppliers and there is scope do this without harming the
21、 cash flow cycle. As mentioned before there may be some problems with the credit control function which may require further investigation.Inventory turnover has been largely stable over the last two periods with a marginal deterioration. It should be noted that this type of business will by necessit
22、y have to hold large inventories.S4 .3 Financial Ratio Analysis -LiquidityBoth of the liquidity ratios prima facie indicate short-term insolvency compared to standard benchmarks as they appear dangerously low and, have been reduced considerably during the last financial period. However, it must be r
23、ecognised that the company derives most of its revenues from cash sales with comparatively low credit sales so it is generating large positive cash streams on an almost daily basis all year around thus permitting it to operate below traditional solvency levels. Therefore, this performance needs to b
24、e contextualised with its sector norms and, against that of its rival companies such M&B, Punch Taverns and Enterprise Inns for example before an informed evaluation may be made. S5. GearingThe company is heavily reliant on long-term and short-term debt financing rather than equity and reserves. Con
25、sequently the gearing which is a measure of financial risk and the company is highly geared indicating a potential high level of financial risk especially if another economic downturn occurs. However, this level of gearing has been constant without so far posing any immediate threats. Current financ
26、e charges attached to the borrowings are covered 3.1 times (i.e. operating profit finance costs) the same as in 2007 so indicating no major financial risk of the company being unable to service the debt interest from existing operating profit streams.AppendicesVertical Trend Analysis Income Statemen
27、tsJ D Wetherspoon Plc Statement of Comprehensive Income for year ending 27th July2009%2008%2007%Revenue100100100Cost of Sales(86)(85.9)(85.8)Gross ProfitOperating Expenses()(4.1)(4.0)Operating Profit before exceptional itemsExceptional Items(2.3)()-Operating Profit after exceptional itemsFinance Inc
28、omeinsignificantinsignificantinsignificantFinance Costs(3.3)(3.6)()Fair value loss /gain on derivatives()-Profit before taxIncome tax expense(2.1)()(1.7)Profit after taxIf the underlying profits are taken instead, i.e. ignoring exceptional items which are one off costs then the underlying profit per
29、centages would be;200900020080002007000Profit before exceptional Items45,20139,00946,834Profit %4.7%4.3%5.2%Note roundings of the calculated figures have been exercisedHorizontal Trend Analysis Income Statements(Using 2007 as the base year exceptional items are ignored as they are non recurrent)J D
30、Wetherspoon Plc Statement of Comprehensive Income for year ending 27th July2009%2008%2007%Revenue100Cost of Sales(100.2)(100.1)-Gross Profit-Operating ExpensesOperating profit ()()-Finance Incomeinsignificantinsignificant-Finance Costs()()-Fair value loss /gain on derivativesinsignificantinsignifica
31、nt-Profit before tax-Income tax expense(129.88)()-Profit after tax-If the underling profits are taken instead, i.e. ignoring exceptional items which are one off costs the underlying profit percentage would be:200900020080002007000Profit before exceptional Items45,20139,00946,834Profit %96.5%100%Note
32、 roundings of the calculated figures have been exercisedJ D Wetherspoon Plc Comprehensive Statement of Position as at 27th July Vertical Trend Analysis 2009%2008%2007%ASSETSNon-Current AssetsProperty, Plant and EquipmentIntangiblesDeferred Income Tax AssetsOther Non Current AssetsTotal Non Current A
33、ssetsCurrent AssetsInventoriesTrade and other receivablesAssets held for saleinsignificantCash and cash equivalentsTotal current assetsTOTAL ASSETS100100100EQUITIES & LIABILITIESShareholders EquityOrdinary SharesShare Premium AccountCapital Redemption ReservesHedging Reserve()Insignificant-Retained
34、EarningsTotal shareholders equityNon-Current LiabilitiesFinancial LiabilitiesDerivative Financial InstrumentsDeferred Tax LiabilitiesProvisions and other obligationsTotal Non Current liabilitiesCurrent LiabilitiesTrade and other payablesFinancial liabilities12.0Current income tax liabilitiesDerivati
35、ve financial instruments-Total current liabilitiesTOTAL EQUITY AND LIABILITIES100100100J D Wetherspoon Plc Comprehensive Statement of Position as at 27th July Horizontal Trend Analysis (using 2007 as the base year)2009%2008%2007%ASSETSNon-Current AssetsProperty, Plant and Equipment100Intangibles-Def
36、erred Income Tax Assets1059.8-Other Non Current Assets-Total Non Current Assets-Current AssetsInventories-Trade and other receivables11-Assets held for sale133.8-Cash and cash equivalents-Total current assets-TOTAL ASSETS-EQUITIES & LIABILITIESShareholders EquityOrdinary Shares100Share Premium Accou
37、nt-Capital Redemption Reserves-Hedging Reserve()()-Retained Earnings-Total shareholders equityNon-Current LiabilitiesFinancial Liabilities-Derivative Financial Instruments-Deferred Tax Liabilities-Provisions and other obligations-Total Non Current liabilities-Current LiabilitiesTrade and other payab
38、les-Financial liabilities-Current income tax liabilities-Derivative financial instruments100-Total current liabilities-TOTAL EQUITY AND LIABILITIES-Financial Ratio Analysis200920082007ProfitabilityROCEOperating Profit x 100Shareholders funds +long-term & short-term loans16.7%14.5%14.8%Gross ProfitGr
39、oss profit x 100Sales14.0%14.1%14.2%Net ProfitNet profit before interest and tax x 100Sales10.1%9.9%10.2%Net profit before interest and tax and exceptional items x 100Sales7.8%9.9%10.2%Return on AssetsProfit before tax and interest x100Total Assets11.32%10.6%10.8%Asset TurnoverRevenue x 100Assets1.1
40、1 times1.06 times1.05 timesEfficiency Receivables (debtors) collection periodTrade receivables x 365 = x daysSales6.2 days5.4 days4.8 daysPayables (creditors) periodTrade payables x 365 = x daysCost of Sales 63.8 days54.00 days57.01 daysInventories TurnoverClosing inventories x 365 = x daysCost of sales 7.9 days7.4 days9.11 daysLiquidityCurrent / Working CapitalCurrent assets = x: 1Current liabilities0.23:10.36:19:1Quick or Acid Test ratioCurrent assets -inventories =x: 1Current liabilities0.16:10.24:10.24:1GearingFixed Interest Capital x 100 Capital employed71.1%71.1%71.8%
- 温馨提示:
1: 本站所有资源如无特殊说明,都需要本地电脑安装OFFICE2007和PDF阅读器。图纸软件为CAD,CAXA,PROE,UG,SolidWorks等.压缩文件请下载最新的WinRAR软件解压。
2: 本站的文档不包含任何第三方提供的附件图纸等,如果需要附件,请联系上传者。文件的所有权益归上传用户所有。
3.本站RAR压缩包中若带图纸,网页内容里面会有图纸预览,若没有图纸预览就没有图纸。
4. 未经权益所有人同意不得将文件中的内容挪作商业或盈利用途。
5. 装配图网仅提供信息存储空间,仅对用户上传内容的表现方式做保护处理,对用户上传分享的文档内容本身不做任何修改或编辑,并不能对任何下载内容负责。
6. 下载文件中如有侵权或不适当内容,请与我们联系,我们立即纠正。
7. 本站不保证下载资源的准确性、安全性和完整性, 同时也不承担用户因使用这些下载资源对自己和他人造成任何形式的伤害或损失。
