 solution manual for 《investment analysis and portfolio management》 ch08

《solution manual for 《investment analysis and portfolio management》 ch08》由会员分享,可在线阅读,更多相关《solution manual for 《investment analysis and portfolio management》 ch08(16页珍藏版)》请在装配图网上搜索。
1、CHAPTER 8AN INTRODUCTION TO ASSET PRICING MODELSAnswers to Questions1.It can be shown that the expected return function is a weighted average of the individual returns. In addition, it is shown that combining any portfolio with the risk-free asset, that the standard deviation of the combination is o
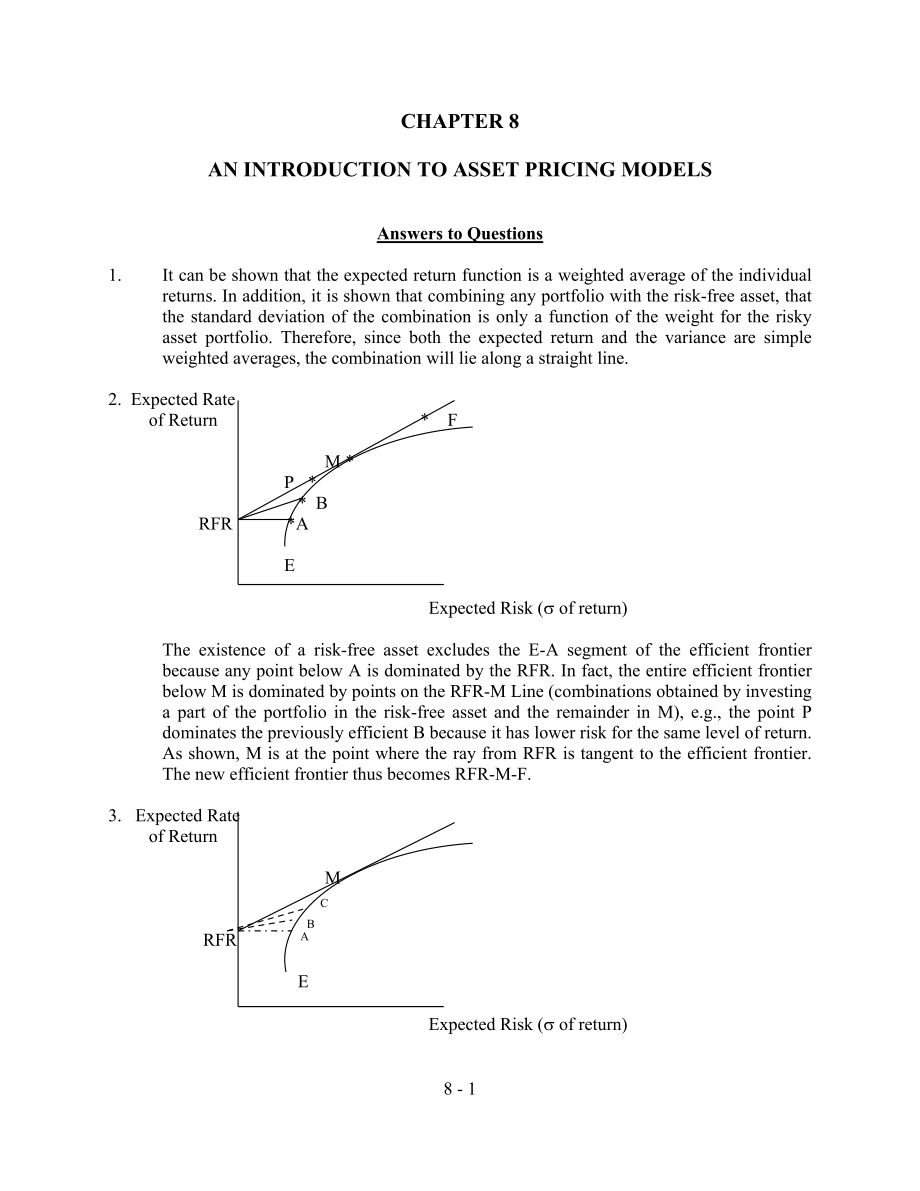
2、nly a function of the weight for the risky asset portfolio. Therefore, since both the expected return and the variance are simple weighted averages, the combination will lie along a straight line.2. Expected Rate of Return * F M * P * * B RFR *A E Expected Risk (s of return)The existence of a risk-f
3、ree asset excludes the E-A segment of the efficient frontier because any point below A is dominated by the RFR. In fact, the entire efficient frontier below M is dominated by points on the RFR-M Line (combinations obtained by investing a part of the portfolio in the risk-free asset and the remainder
4、 in M), e.g., the point P dominates the previously efficient B because it has lower risk for the same level of return. As shown, M is at the point where the ray from RFR is tangent to the efficient frontier. The new efficient frontier thus becomes RFR-M-F.3. Expected Rate of Return M C B RFR A E Exp
5、ected Risk (s of return)This figure indicates what happens as a risk-free asset is combined with risky portfolios higher and higher on the efficient frontier. In each case, as you combine with the higher return portfolio, the new line will dominate all portfolios below this line. This program contin
6、ues until you combine with the portfolio at the point of tangency and this line becomes dominant over all prior lines. It is not possible to do any better because there are no further risky asset portfolios at a higher point.4.The “M” or “market” portfolio contains all risky assets available. If a r
7、isky asset, be it an obscure bond or a rare stamp, was not included in the market portfolio, then there would be no demand for this asset, and consequently, its price would fall. Notably, the price decline would continue to the point where the return would make the asset desirable such that it would
8、 be part of the M portfolio - e.g., if the bonds of ABC Corporation were selling for 100 and had a coupon of 8 percent, the investors return would be 8 percent; however, if there was no demand for ABC bonds the price would fall, say to 80, at which point the 10 percent (80/800) return might make it
9、a desirable investment. Conversely, if the demand for ABC bonds was greater than supply, prices would be bid up to the point where the return would be in equilibrium. In either case, ABC bonds would be included in the market portfolio.5.Leverage indicates the ability to borrow funds and invest these
10、 added funds in the market portfolio of risky assets. The idea is to increase the risk of the portfolio (because of the leverage), and also the expected return from the portfolio. It is shown that if you can borrow at the RFR then the set of leveraged portfolios is simply a linear extension of the s
11、et of portfolios along the line from the RFR to the market portfolio. Therefore, the full CML becomes a line from the RFR to the M portfolio and continuing upward.6.You can measure how well diversified a portfolio is by computing the extent of correlation between the portfolio in question and a comp
12、letely diversified portfolio - i.e., the market portfolio. The idea is that, if a portfolio is completely diversified and, therefore, has only systematic risk, it should be perfectly correlated with another portfolio that only has systematic risk.7.Standard deviation would be expected to decrease wi
13、th an increase in stocks in the portfolio because an increase in number will increase the probability of having more inversely correlated stocks. There will be a major decline from 4 to 10 stocks, a continued decline from 10 to 20 but at a slower rate. Finally, from 50 to 100 stocks, there is a furt
14、her decline but at a very slow rate because almost all unsystematic risk is eliminated by about 18 stocks.8.Given the existence of the CML, everyone should invest in the same risky asset portfolio, the market portfolio. The only difference among individual investors should be in the financing decisi
15、on they make, which depends upon their risk preference. Specifically, investors initially make investment decisions to invest in the market portfolio, M. Subsequently, based upon their risk preferences, they make financing decisions as to whether to borrow or lend to attain the preferred point on th
16、e CML.9.Recall that the relevant risk variable for an individual security in a portfolio is its average covariance with all other risky assets in the portfolio. Given the CML, however, there is only one relevant portfolio and this portfolio is the market portfolio that contains all risky assets. The
17、refore, the relevant risk measure for an individual risky asset is its covariance with all other assets, namely the market portfolio.10.Systematic risk refers to that portion of total variability of returns caused by factors affecting the prices of all securities, e.g., economic, political and socio
18、logical changes -factors that are uncontrollable, external, and broad in their effect on all securities.Unsystematic risk refers to factors that are internal and “unique” to the industry or company, e.g., management capability, consumer preferences, labor strikes, etc. Notably, it is not possible to
19、 get rid of the overall systematic risk, but it is possible to eliminate the “unique” risk for an individual asset in a diversified portfolio.11.In a capital asset pricing model (CAPM) world the relevant risk variable is the securitys systematic risk - its covariance of return with all other risky a
20、ssets in the market. This risk cannot be eliminated. The unsystematic risk is not relevant because it can be eliminated through diversification - for instance, when you hold a large number of securities, the poor management capability, etc., of some companies will be offset by the above average capa
21、bility of others.12.For plotting, the SML the vertical axis measures the rate of return while the horizontal axis measures normalized systematic risk (the securitys covariance of return with the market portfolio divided by the variance of the market portfolio). By definition, the beta (normalized sy
22、stematic risk) for the market portfolio is 1.0 and is zero for the risk-free asset. It differs from the CML where the measure of risk is the standard deviation of return (referred to as total risk).13. CFA Examination I (1993)Any three of the following are criticisms of beta as used in CAPM.1. Theor
23、y does not measure up to practice. In theory, a security with a zero beta should give a return exactly equal to the risk-free rate. But actual results do not come out that way, implying that the market values something besides a beta measure of risk.2. Beta is a fickle short-term performer. Some sho
24、rt-term studies have shown risk and return to be negatively related. For example, Black, Jensen and Scholes found that from April 1957 through December 1965, securities with higher risk produced lower returns than less risky securities. This result suggests that (1) in some short periods, investors
25、may be penalized for taking on more risk, (2) in the long run, investors are not rewarded enough for high risk and are overcompensated for buying securities with low risk, and (3) in all periods, some unsystematic risk is being valued by the market.3. Estimated betas are unstable. Major changes in a
26、 company affecting the character of the stock or some unforeseen event not reflected in past returns may decisively affect the securitys future returns.4. Beta is easily rolled over. Richard Roll has demonstrated that by changing the market index against which betas are measured, one can obtain quit
27、e different measures of the risk level of individual stocks and portfolios. As a result, one would make different predictions about the expected returns, and by changing indexes, one could change the risk-adjusted performance ranking of a manager.14. CFA Examination I (1993)Under CAPM, the only risk
28、 that investors should be compensated for bearing is the risk that cannot be diversified away (systematic risk). Because systematic risk (measured by beta) is equal to one for both portfolios, an investor would expect the same return for Portfolio A and Portfolio B.Since both portfolios are fully di
29、versified, it doesnt matter if the specified risk for each individual security is high or low. The specific risk has been diversified away for both portfolios.15. CFA Examination II (1994)15(a).The concepts are explained as follows:The Foundations portfolio currently holds a number of securities fro
30、m two asset classes. Each of the individual securities has its own risk (and return) characteristics, described as specific risk. By including a sufficiently large number of holdings, the specific risk of the individual holdings offset each other, diversifying away much of the overall specific risk
31、and leaving mostly nondiversifiable or market-related risk.Systematic risk is market-related risk that cannot be diversified away. Because systematic risk cannot be diversified away, investors are rewarded for assuming this risk.The variance of an individual security is the sum of the probability-we
32、ighted average of the squared differences between the securitys expected return and its possible returns. The standard deviation is the square root of the variance. Both variance and standard deviation measure total risk, including both systematic and specific risk. Assuming the rates of return are
33、normally distributed, the likelihood for a range of rates may be expressed using standard deviations. For example, 68 percent of returns may be expressed using standard deviations. Thus, 68 percent of returns can be expected to fall within + or -1 standard deviation of the mean, and 95 percent withi
34、n 2 standard deviations of the mean.Covariance measures the extent to which two securities tend to move, or not move, together. The level of covariance is heavily influenced by the degree of correlation between the securities (the correlation coefficient) as well as by each securitys standard deviat
35、ion. As long as the correlation coefficient is less than 1, the portfolio standard deviation is less than the weighted average of the individual securities standard deviations. The lower the correlation, the lower the covariance and the greater the diversification benefits (negative correlations pro
36、vide more diversification benefits than positive correlations).The capital asset pricing model (CAPM) asserts that investors will hold only fully diversified portfolios. Hence, total risk as measured by the standard deviation is not relevant because it includes specific risk (which can be diversifie
37、d away).Under the CAPM, beta measures the systematic risk of an individual security or portfolio. Beta is the slope of the characteristic line that relates a securitys returns to the returns of the market portfolio. By definition, the market itself has a beta of 1.0. The beta of a portfolio is the w
38、eighted average of the betas of each security contained in the portfolio. Portfolios with betas greater than 1.0 have systematic risk higher than that of the market; portfolios with betas less than 1.0 have lower systematic risk. By adding securities with betas that are higher (lower), the systemati
39、c risk (beta) of the portfolio can be increased (decreased) as desired.15(b).Without performing the calculations, one can see that the portfolio return would increase because: (1) Real estate has an expected return equal to that of stocks. (2) Its expected return is higher than the return on bonds.T
40、he addition of real estate would result in a reduction of risk because: (1) The standard deviation of real estate is less than that of both stocks and bonds. (2) The covariance of real estate with both stocks and bonds is negative.The addition of an asset class that is not perfectly correlated with
41、existing assets will reduce variance. The fact that real estate has a negative covariance with the existing asset classes will reduce risk even more.15(c).Capital market theory holds that efficient markets prevent mispricing of assets and that expected return is proportionate to the level of risk ta
42、ken. In this instance, real estate is expected to provide the same return as stocks and a higher return than bonds. Yet, it is expected to provide this return at a lower level of risk than both bonds and stocks. If these expectations were realistic, investors would sell the other asset classes and b
43、uy real estate, pushing down its return until it was proportionate to the level of risk.Appraised values differ from transaction prices, reducing the accuracy of return and volatility measures for real estate. Capital market theory was developed and applied to the stock market, which is a very liqui
44、d market with relatively small transaction costs. In contrast to the stock market, real estate markets are very thin and lack liquidity.16. First, the stability of beta: It is important to know whether it is possible to use past betas as estimates of future betas. Second, is there a relationship bet
45、ween beta and rates of return? This would indicate whether the CAPM is a relevant pricing model that can explain rates of return on risky assets.17. Given that beta is the principal risk measure, stable betas make it easier to forecast future beta measures of systematic risk i.e., can betas measured
46、 from past data be used in making investment decisions?18. The results of the stability of beta studies indicate that betas for individual stocks are generally not stable, but portfolios of stocks have stable betas.19. Is there a positive linear relationship between the systematic risk of risky asse
47、ts and the rates of return on these assets? Are the coefficients positive and significant? Is the intercept close to the riskfree rate of return?20. E(R) Theoretical SML Empirical SML RFR RM1.0 Risk (Beta)In the empirical line, low risk securities did better than expected, while high risk securities
48、 did not do as well as predicted.21. The “market” portfolio contains all risky assets available. If a risky asset, be it an obscure bond or rare stamp, was not included in the market portfolio, then there would be no demand for this asset and, consequently, its price would fall. Notably, the price d
49、ecline would continue to the point where the return would make the asset desirable such that it would be part of the “market” portfolio. The weights for all risky assets are equal to their relative market value.22. According to Roll, a mistakenly specified proxy for the market portfolio can have two
50、 effects. First, the beta computed for alternative portfolios would be wrong because the market portfolio is inappropriate. Second, the SML derived would be wrong because it goes from the RFR through the improperly specified market portfolio. In general, when comparing the performance of a portfolio
51、 manager to the “benchmark” portfolio, these errors will tend to overestimate the performance of portfolio managers because the proxy market portfolio employed is probably not as efficient as the true market portfolio, so the slope of the SML will be underestimated. 23. Studies of the efficient mark
52、ets hypothesis suggest that additional factors affecting estimates of expected returns include firm size, the priceearnings ratio, and financial leverage. These variables have been shown to have predictive ability with respect to security returns.24. Fama and French found that size, leverage, earnin
53、gsprice ratios, and book value to market value of equity all have a significant impact on univariate tests on average return. In multivariate tests, size and book to market equity value are the major explanatory factors. CHAPTER 8Answers to Problems1. Rate of SMLc Return SMLb E(Rmc) .17 SMLc E(Rmb)
54、.15 E(Rmc) .12 RFRc=RFRb .09 RFRa .06 1.0 Systematic Risk (Beta)In (b), a change in risk-free rate, with other things being equal, would result in a new SMLb, which would intercept with the vertical axis at the new risk-free rate (.09) and would be parallel in the original SMLa.In (c), this indicate
55、s that not only did the risk-free rate change from .06 to .09, but the market risk premium per unit of risk E(Rm) - Rf also changed from .06 (.12 - .06) to .08 (.17 - .09). Therefore, the new SMLc will have an intercept at .09 and a different slope so it will no longer be parallel to SMLa.2.E(Ri) =
56、RFR + bi(RM - RFR) = .10 + bi(.14 - .10) = .10 + .04biStockBeta(Required Return) E(Ri) = .10 + .04biU85.10 + .04(.85) = .10 + .034 = .134N1.25.10 + .04(1.25)= .10 + .05 = .150D-.20.10 + .04(-.20) = .10 - .008 = .0923.StockCurrent PriceExpected PriceExpected DividendEstimated ReturnU22240.75N48512.00
57、D37401.25StockBetaRequiredEstimatedEvaluation U.85.134.1250OvervaluedN1.25.150.1042OvervaluedD-.20.092.1149Undervalued If you believe the appropriateness of these estimated returns, you would buy stocks D and sell stocks U and N. E(R) N 14% U *U *D * N D -0.5 -0.2 0.5 .085 1.0 1.25 4.Student Exercis
58、e5.Student Exercise6.Student Exercise7.Student Exercise8.Student Exercise9.Student Exercise10.Student Exercise11(a).then COVi,m = (ri,m)(si)( sm)For Intel:COV i,m = (.72)(.1210)(.0550) = .00479For Ford:COV i,m = (.33)(.1460)(.0550) = .00265For Anheuser Busch:COV i,m = (.55)(.0760)(.0550) = .00230For Merck:COV i,m = (.60)(.1020)(.0550) = .0033711(b).E(Ri) = RFR + Bi(RM - RFR) = .08 + Bi(.15 - .08)
- 温馨提示:
1: 本站所有资源如无特殊说明,都需要本地电脑安装OFFICE2007和PDF阅读器。图纸软件为CAD,CAXA,PROE,UG,SolidWorks等.压缩文件请下载最新的WinRAR软件解压。
2: 本站的文档不包含任何第三方提供的附件图纸等,如果需要附件,请联系上传者。文件的所有权益归上传用户所有。
3.本站RAR压缩包中若带图纸,网页内容里面会有图纸预览,若没有图纸预览就没有图纸。
4. 未经权益所有人同意不得将文件中的内容挪作商业或盈利用途。
5. 装配图网仅提供信息存储空间,仅对用户上传内容的表现方式做保护处理,对用户上传分享的文档内容本身不做任何修改或编辑,并不能对任何下载内容负责。
6. 下载文件中如有侵权或不适当内容,请与我们联系,我们立即纠正。
7. 本站不保证下载资源的准确性、安全性和完整性, 同时也不承担用户因使用这些下载资源对自己和他人造成任何形式的伤害或损失。
