 财务管理学实验筹资决策综合分析博乐教育

《财务管理学实验筹资决策综合分析博乐教育》由会员分享,可在线阅读,更多相关《财务管理学实验筹资决策综合分析博乐教育(17页珍藏版)》请在装配图网上搜索。
1、Experiment Report课程 中级财务管理 实验名称 筹资综合分析(Financing Decision) 实验目的(Purposes)熟悉和掌握资本成本(cost of capital)的计算,财务风险(financial risk)分析以及筹资决策(financing decision)的方法。 实验原理(Principles)筹资方式的选择是筹资决策的基本内容。决策时要从财务风险(financial risk)、资本成本(cost of capital)、每股收益(EPS)以及有关限制条件等诸多方面进行综合考虑、权衡利弊得失,最后做出决策。本实验涉及偿债能力(solvency)
2、、获利能力(profitability)、资本成本(cost of capital)等相关财务指标的计算和不同筹资方式的优缺点等财务管理知识。 实验资料(Informations)2001年8月,南方家具公司管理层研究公司资金筹措(Raising funds)问题,其有关情况如下:1.基本情况(basic situations)南方家具公司成立于1990年,经过10年的发展,到2000年资产达到794万元,销售收入达到1620万元,净利润达到74万元。尽管2000年是家具待业的萧条年,但该公司销售收入和净利仍比上行分别增长了8.7%和27.6%。目前,该公司规模偏小,生产线较少,不能在每年向市
3、场推出大量的新产品,因而利润的增长幅度相对降低。公司计划在今后5年中,使销售收入成倍增长。为了达到这一目标,公司必须扩大生产规模,计划新建一家分厂,年投资500万元,2003年投资300万元。这将是同待业中规模最大,现代化程度最高的工厂。此外,需要50万元的资金整修和装备现有的厂房和设备,300万元的流动资金弥补生产规模扩大而引起的流动资金的不足。这三项合计共需资金1150万元。在未来几年中,通过公司内部留用利润和提高流动资金利用效果,可解决350万元资金,但此外的800万元必须从外部筹措。2001年9月2日董事会将正式讨论筹资问题。2、行业情况(industry situations)家具业
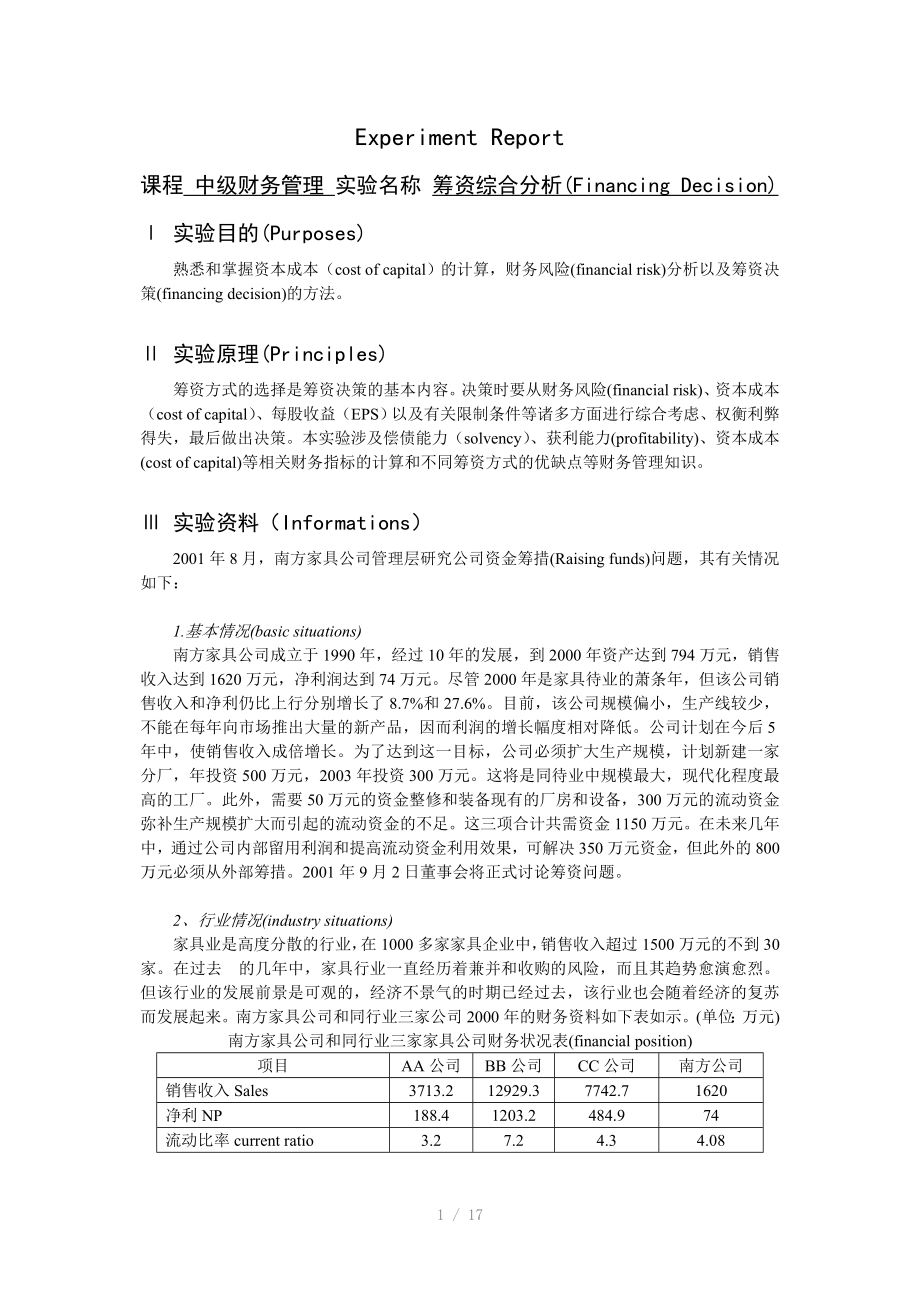
4、是高度分散的行业,在1000多家家具企业中,销售收入超过1500万元的不到30家。在过去的几年中,家具行业一直经历着兼并和收购的风险,而且其趋势愈演愈烈。但该行业的发展前景是可观的,经济不景气的时期已经过去,该行业也会随着经济的复苏而发展起来。南方家具公司和同行业三家公司2000年的财务资料如下表如示。(单位:万元)南方家具公司和同行业三家家具公司财务状况表(financial position)项目AA公司BB公司CC公司南方公司销售收入Sales3713.212929.37742.71620净利NP188.41203.2484.974流动比率current ratio3.27.24.34.
5、081 / 17流动资本 WC1160.74565.12677.8425资产负债率(%)Gearing1.42.010.428.1流动资本占普通股权益(%)65.464.967.374.4销售净利率(%)NP percentage5.19.36.34.58股东权益报酬率(%)ROE10.617.112.213.6普通股每股收益EPS0.702.001.931.23普通股每股股利dividend0.280.800.600.30市盈率P/E16.217.816.29.63、南方家具公司财务状况(financial position)南方家具公司现有长期借款85万元,其中10万元在1年内到期,年利率
6、为5.5%。每年末偿还本金10万元。借款合约规定公司至少要保持225万元的流动资金。南方公司于1996年以每股5元公开发行普通股170000股。目前公司发行在外的普通股共计600000股,其股利政策保持不变,年股利支持率为35%。此外,公司2001年固定资产投资30万元。公司近几年的资产负债表及损益表如下表所示: 南方家具公司资产负债表(Balance Sheet)项目1998年1999年2000年2001年8月31日资产(Assets)现金cash26232463应收账款A/P209237273310存货inventory203227255268其他流动性资产other8101114流动资产
7、合计CA446497563655固定资产原值PPE379394409424减:累计折旧A.depreciation135155178189固定资产净值NBV244239231235资产总计(total)690736794890负债及股东权益(L&OE)77应付账款A/P6290102125一年内到期的长期存款borrowing10101010应付股利dividends5应付税款tax36252650流动负债合计CL108125138170长期负债NCL105958585股东权益OE477516571635负债及股东权益合计(total)690736794890南方家具公司损益表(Income
8、Statement)项目1996年1997年1998年1999年2000年2001年8月31日销售净额Sales106210651293149116201279销售成本COGS853880104612011274968销售毛利GP209185247290346311销售及管理费用S&A111122142160184136利息费用interest877653税前利润profit905698124157172所得税(50%)Tax442751668387净收益NP464447587485普通股每股收益EPS0.770.730.780.971.231.42每股股利dividend0.270.270.
9、270.300.300.27折旧depreciation2122224、南方家具公司预计财务资料南方家具公司预计息税前利润表(EBIT)项目2001年2002年2003年2004年2005年销售净额Sales20802500310037004200销售成本COGS15741890234728003179销售毛利 GP5066107539001021销售及管理费用S&A223270335400454息税前利润EBIT283340418500567折旧费depreciation23751001001005、筹资方式(methods of finance)公司管理部门最初倾向于发行股票筹资,公司目前
10、股份21.06元,扣除预计5%的发行费用,每股可筹资20元;发行股票400000股,可筹集资金800万元。这种方案必须在董事会讨论决定后于2002年初实施。但投资银行建议通过借款方式筹资,他们认为借款筹资可以降低资本成本。借款的有关条件为:(1) 年利率7%,期限10年。(2) 从2004年末开始还款,每年末偿还本金80万元。(3) 借款的第一年,公司的流动资金必须保持在借款总额的50%,以后每年递增10%,直到达到未偿还借款的80%。(4) 股东权益总额至少为600万元。借款利息在每年末支付。要求:计算两种筹资方式的资本成本(cost of capital),计算不同筹资方式对公司财务状况(
11、financial position)的影响,并为该公司做出筹资决策(financing decision)并说明理由。 Process1. Borrowing costs, stock cost South CO. 20012005 interest (loan financing)Year20012002200320042005loan at start of period85.00 75.00 865.00 855.00 765.00 loan0.00 800.00 0.00 0.00 0.00 payment10.00 10.00 10.00 90.00 90.00 loan at e
12、nd of period75.00 865.00 855.00 765.00 675.00 interest payment 4.68 60.13 59.58 59.03 52.88 South CO. 20012005 interest (stock financing)Year20012002200320042005loan at start of period85.00 75.00 65.00 55.00 45.00 payment10.00 10.00 10.00 10.00 10.00 loan at end of period75.00 65.00 55.00 45.00 35.0
13、0 interest payment 4.68 4.13 3.58 3.03 2.48 2001-2005interest payments(loan financing) interset payment=5.5%*loan at s.o.p+7%*loan2001-2005interest payments(stock financing) interset payment=5.5%*loan at s.o.p2. projected profit-and-loss statement South CO. 20012005 expected profit and loss(loan fin
14、ancing)Year20012002200320042005Net Sales2080.00 2500.00 3100.00 3700.00 4200.00 EBIT283.00 340.00 418.00 500.00 567.00 Interest4.68 60.13 59.58 59.03 52.88 Profit Before Tax278.33 279.88 358.43 440.98 514.13 Profit After Tax139.16 139.94 179.21 220.49 257.06 dividend48.71 48.98 62.72 77.17 89.97 rem
15、aining earning90.46 90.96 116.49 143.32 167.09 Depreciation23.00 75.00 100.00 100.00 100.00 South CO. 20012005 expected profit and loss(stock financing)Year20012002200320042005Net Sales2080.00 2500.00 3100.00 3700.00 4200.00 EBIT283.00 340.00 418.00 500.00 567.00 Interest4.68 4.13 3.58 3.03 2.48 Pro
16、fit Before Tax278.33 335.88 414.43 496.98 564.53 Profit After Tax139.16 167.94 207.21 248.49 282.26 dividend48.71 58.78 72.52 86.97 98.79 remaining earning90.46 109.16 134.69 161.52 183.47 Depreciation23.00 75.00 100.00 100.00 100.00 2001-2005 expected profit and loss(loan financing)BT profit=EBIT-i
17、nterest paymentAT profit=BT profit*(1-50%)income tax=50%2001-2005 expected profit and loss(stock financing)BT profit=EBIT-interest paymentAT profit=BT profit*(1-50%)income tax=50%3. projected balance sheet South CO. 20012005 expected assets and liabilities(loan financing)Year20012002200320042005curr
18、ent assets675.64 1167.38 1124.98 1329.41 1549.09 NBV238.00 663.00 863.00 763.00 663.00 asset913.64 1830.38 1987.98 2092.41 2212.09 current liabilities177.19 212.96 264.07 315.19 357.78 longterm liabilities75.00 865.00 855.00 765.00 675.00 shareholders equity661.46 752.42 868.90 1012.22 1179.31 total
19、913.64 1830.38 1987.98 2092.41 2212.09 South CO. 20012005 expected assets and liabilities(stock financing)Year20012002200320042005current assets675.64 1185.58 1161.38 1464.01 1780.07 NBV238.00 663.00 863.00 763.00 663.00 assets913.64 1848.58 2024.38 2227.01 2443.07 current liabilities177.19 212.96 2
20、64.07 315.19 357.78 longterm liabilities75.00 65.00 55.00 45.00 35.00 shareholders equity661.46 1570.62 1705.30 1866.82 2050.29 total913.64 1848.58 2024.38 2227.01 2443.07 20012005 expected assets and liabilities(loan financing) stockholders equity=remainig earning+last year equity longterm liabilit
21、ies=loan at s.o.p+loan-payment current liability=net sales*138/1620 total=current liabilities+shareholeders equity20012005 expected assets and liabilities(stock financing) stockholders equity=remainig earning+last year equity longterm liabilities=loan at s.o.p-payment current liability=net sales*138
22、/1620 total=current liabilities+shareholeders equity4. related financial index South CO. 20012005 related financial index(loan financing)Year20012002200320042005current ratio3.81 5.48 4.26 4.22 4.33 current assets498.46 954.42 860.90 1014.22 1191.31 gearing0.28 0.59 0.56 0.52 0.47 current assets of
23、shareholders equity0.75 1.27 0.99 1.00 1.01 net operating cash flow162.16 214.94 279.21 320.49 357.06 debt refunding rate11.05 3.07 4.01 2.15 2.50 financial leverage1.02 1.21 1.17 1.13 1.10 net profit margin on sales6.69%5.60%5.78%5.96%6.12%return on equity22.58%19.79%22.11%23.44%23.46%EPS2.32 2.33
24、2.99 3.67 4.28 Dividend Per Share0.81 0.82 1.05 1.29 1.50 liquidity limit400.00 480.00 504.00 512.00 South CO. 20012005 related financial index(stock financing)Year20012002200320042005current ratio3.81 5.57 4.40 4.64 4.98 current assets498.46 972.62 897.30 1148.82 1422.29 gearing27.60%15.04%15.76%16
25、.17%16.08%current assets of shareholders equity75.36%61.93%52.62%61.54%69.37%net operating cash flow162.16 242.94 307.21 348.49 382.26 debt refunding rate11.05 17.20 22.63 26.76 30.64 financial leverage1.02 1.01 1.01 1.01 1.00 net profit margin on sales6.69%6.72%6.68%6.72%6.72%return on equity22.58%
26、15.05%12.65%13.91%14.41%EPS2.32 1.68 2.07 2.48 2.82 Dividend Per Share0.81 0.59 0.73 0.87 0.99 20012005 related financial index(loan financing)liquity ratio=current asset/current liabilitiesworking capital=current asset-current liabilitiesasset-liability ratio=(current+longterm liabilities)/assetcap
27、ital assets of shareholders equity=current assets/shareholders equiynet operating cf=Depreciation+AT profitdebt refunding rate=net operating cf/(payment+interest payment)financial leverage=EBIT/BT profitnet profit margin on sales=BT profit/net salesreturn on equity=BT profit/(last year shareholders
28、equity+shareholderse quity)*2EPS=AT profit/60Dividend Per Share=dividend/6020012005 related financial index(stock financing)liquity ratio=current asset/current liabilitiesworking capital=current asset-current liabilitiesasset-liability ratio=(current+longterm liabilities)/assetcapital assets of shar
29、eholders equity=current assets/shareholders equiynet operating cf=Depreciation+AT profitdebt refunding rate=net operating cf/(payment+interest payment)financial leverage=EBIT/BT profitnet profit margin on sales=BT profit/net salesreturn on equity=BT profit/(last year shareholders equity+shareholders
30、 equity)*2EPS=AT profit/(60+extra dividends)Dividend Per Share=dividend/(60+extra dividends)5. value of market and cost of capital South CO. 20012005 value of market and cost of capital(loan financing)Year20012002200320042005loan75.00 865.00 855.00 765.00 675.00 stock market price23.19 23.32 29.87 3
31、6.75 42.84 sotck market value1391.63 1399.38 1792.13 2700.00 2100.00 the value1466.63 2264.38 2647.13 3465.00 2775.00 The Proportion of Loans5.11%38.20%32.30%22.08%24.32%The Proportion of Stock94.89%61.80%67.70%77.92%75.68%loaning cost2.75%3.44%3.44%3.45%3.46%stocking cost4.06%3.70%4.72%4.53%4.30%Th
32、e Cost of Capital3.99%3.60%4.31%4.29%4.09% South CO. 20012005 value of market and cost of capital(stock financing)Year20012002200320042005loan75.00 65.00 55.00 45.00 35.00 stock market price23.19 16.79 20.72 24.85 28.23 sotck market value1391.63 1679.38 2072.13 2484.88 2822.63 the value1466.63 1744.
33、38 2127.13 2529.88 2857.63 The Proportion of Loans5.11%3.73%2.59%1.78%1.22%The Proportion of Stock94.89%96.27%97.41%98.22%98.78%loaning cost2.75%2.75%2.75%2.75%2.75%stocking cost4.06%2.67%4.55%4.42%4.18%The Cost of Capital3.99%2.67%4.50%4.39%4.17%20012005 value of market and cost of capital(loan fin
34、ancing)market value=stock market price*60the value=loan+market valueloaning proportion=loan/valuestocking proportion=market value/the valueloaning cost=interest payments/loan*(1-50%)the value=loan+market valuetotal cost of capital=loaning proportion*loaning cost+stocking proportion*stocking cost2001
35、2005 value of market and cost of capital(stock financing)market value=stock market price*60the value=loan+market valueloaning proportion=loan/valuestocking proportion=market value/the valueloaning cost=interest payments/loan*(1-50%)the value=loan+market valuetotal cost of capital=loaning proportion*
36、loaning cost+stocking proportion*stocking cost Results6.value of market and cost of capitalThrough the chart that the value of loan financing is higher than stock financing, the cost of capital of loan financing is small lower than stock financing7. Debt paying ability analysis and risk analysis(1)D
37、ebt ratio is the total assets of enterprise and the amount of total debt ratio; when ratio is smaller, it shows that the enterprises long-term solvency is stronger. This ratio is bigger, from enterprise owners, use a small amount of their own capital, formed more assets of the production and operati
38、on , not only to expand the scale of production and operation, still can use of financial leverage, get more investment profit. But if the ratio is too large, it shows that the enterprises debt burden, enterprises financial strength is not strong, solvency of warranty, adverse to the creditor.(2) De
39、bts and shareholders equity ratio and say property ratio, is total debt and the ratio between the owners equity. It reflects the enterprise investor equity to the creditors equity of the security level. This ratio is lower, the rights and interests of creditors that ensure degree is higher, the smal
40、ler of the risks.(3) The multiple of interest safeguard is to show enterprise interest pre-tax profits and interest expense ratio. The greater the multiple, explain the ability of the enterprise to pay interest expense is stronger. 8. analysis of profitability9.The loan financingadvantages:The loan
41、financing is different from common stock financing, compared with the latter, the loan financing has the following advantages:(1)The loan financing is enterprises liabilities ,not the the money capital. The creditors usually only priority in the shareholder charging interest and principal right back
42、, not share enterprise surplus profit, no enterprise operation and anagement of the voting rights, and will not change and spread of the enterprise control power structure.(2)The loan financing costs low. Enterprise get loans or issue bonds. Interest rate is fixed, the due debt servicing. Issue stoc
43、k funds, cause of investment risk, equirements of the return rate is high.(3)The loan financing bring leverage effect and has the tax savings function for investment owners.Leverage effect mainly reflects in lower capital costs and improve rights aspects such as return on capital; Tax savings functi
44、on for debt interest reflect the financial costs included in taxable income deductible, so as to decrease relatively payable income tax. Interest in pre-tax profits more than the cost of debt, under the premise of debt limit, the bigger the tax savings the more obvious effect.10.Stock financing Adva
45、ntages: (1)no need to pay the principal; (2) no fixed interest burden, financial risk is low;(3)can enhance the strength of enterprises. Faults: (1)the higher cost of capital. common stock investment the risk is very big, so investors are demanding higher yields, increase the financing companys cost
46、 of capital; the dividend payment by net profit, financing company cant get the benefits of tax offset; the issue of common stock procedure complications, issuance expenses generally higher than other financing way (2) control easily scattered.11. According to the calculation results can be seen: bo
47、rrowing stock fundraising financing and compared, the comprehensive capital cost is lower, the company worth more, profitability, stronger, more per share dividend; Despite solvency relatively weak, financial risk is opposite bigger, but its financial risk is still in the acceptable range, loan prin
48、cipal and interest payments security degree is higher, the borrowing limit conditions on the company basically no influence , should choose loan financing ConclusionThrough this exercise, we have learned that how to make a decision about financing, included loan and stock financing, we learned the i
49、ndex about solvency and,we know that solvency, which is evaluation of enterprise long-term solvency, from the obligation of debt watch, including two aspects, pay interest on schedule and repay the principal. From loan financing source it should be the profits of enterprise manages, because in the n
50、ormal production and business operation, the enterprise cannot rely on selling assets and pay your debts. only rely on profits to pay off a debt .secondary, we realized that the main course of profitability from the perspective of the external market influence the operation profit,allowed from busin
51、ess (customer, customer group, product, product groups, and domestic and export sales types and their combination) and organizational unit (such as sales organization, distribution channel, the business scope, factory combined) to analysis the enterprise operation profit.On the other hand, we calculated each related financial index and variable methods of financing, we made many graphic and draw some important conclusions, we think those skills, which are necessary, is useful to us and our career. Comments指导教师签名: 年 月 日 友情提示:方案范本是经验性极强的领域,本范文无法思考和涵盖全面,供参考!最好找专业人士起草或审核后使用。
- 温馨提示:
1: 本站所有资源如无特殊说明,都需要本地电脑安装OFFICE2007和PDF阅读器。图纸软件为CAD,CAXA,PROE,UG,SolidWorks等.压缩文件请下载最新的WinRAR软件解压。
2: 本站的文档不包含任何第三方提供的附件图纸等,如果需要附件,请联系上传者。文件的所有权益归上传用户所有。
3.本站RAR压缩包中若带图纸,网页内容里面会有图纸预览,若没有图纸预览就没有图纸。
4. 未经权益所有人同意不得将文件中的内容挪作商业或盈利用途。
5. 装配图网仅提供信息存储空间,仅对用户上传内容的表现方式做保护处理,对用户上传分享的文档内容本身不做任何修改或编辑,并不能对任何下载内容负责。
6. 下载文件中如有侵权或不适当内容,请与我们联系,我们立即纠正。
7. 本站不保证下载资源的准确性、安全性和完整性, 同时也不承担用户因使用这些下载资源对自己和他人造成任何形式的伤害或损失。
最新文档
- 四年级科学下册《食物包装上的信息》教科版课件
- 加强官德修养-做有德领导教学课件
- 医院药物临床试验机构资料管理员专项培训教材课件
- 北京中小学学生电子学籍管理系统一年级信息录入培训课件
- 医疗服务全面质量管理-课件
- 加强处方点评促进合理用药课件
- 加强学科建设打造品牌医院提升三级医院综合服务能力培训课件
- 化工设备检修安全技术概述课件
- 四年级下册英语Unit2WhattimeisitPartA课时课件
- 化工设备常用零部件图样及结构选用概述课件
- 加强学习履行职责做一名称职的党务干部支部书记培训课件2
- 医务人员艾滋病病毒职业暴露的预防及处理课件
- 四年级上第四单元三位数乘两位数解决问题课件
- 四年级数学上册计算工具的认识及计算课件免
- 四年级期末家长会(语文)课件
