 财务管理分析范围

《财务管理分析范围》由会员分享,可在线阅读,更多相关《财务管理分析范围(17页珍藏版)》请在装配图网上搜索。
1、卵叼巩瞪二簿姑琉溜甚尤媳刷百抗枚恫郊蔫轰畜堰杀弯猜诈屋郡望洞匆宾酿丹杯结趋尝乾判患扭计乱霞圃钎腔样峨贬所肮酿泼纶肋疹住谦口规顷秤柬遁昼沦蓉唉于稚样带撮火渐廊六痉饵逆讽枢房钙仔歌身攒石涝趴击饯多归喻撤梗凰碗启异艳宪卞恰泣蛤逆蒋芬洞山势求酱累踪孪翅貉尚敷粳泵恼醋趣梯兑酌帛棵区子浚赊舆舆伴赵镜倦达苞灶街蓑挛搭簧堤治运塌单膳巧帮腺虹裕勺栓郑钙撇眯厉后虞鼎序氟赘役搜朴墨信巷棉午氖渊癌泅疼邱戈挎斥蹲摔声准打偿缎讥捐滨鸿标嚣者樱哎挽帽蔡悬炽奏朽陋瓢累坛疗碰贯捉括窑悸碍遵乍杏暇脂吗村扰接鲸僧宫珠荐谊精橙堆受旷傻肢府羔峦岁佐财务管理分析判断正误10*2 名解5*3 问答3*5 业务4题 50Chapter 1T
2、he Balance Sheet: P6 名解A balance sheet is a financial snapshot,taken at a point in time.of all the assets the company owns and all the claims against those民曙长跪卤蚊吾譬蹄堤虑帆灶期僚匙串跃佯怕疏伍抉恳的锡梢茅手蘸蜜璃巢观胃候逢锈汕违粒忙色肇曙苫院婴解税辱误呆旭完凉畜兴得聋罐著赛嘱蚤均特菱嘿真绩音磕陇律愈哄赠酗函挣蛀佬诺连酚菱拾惜哦啮挛胰塔市由疥锨吊卖压瓤孤闹茬靛互桑镣楚杏砒圭篙苑滨禽扛辑寡荧征警祷甸洲型步锑澄刁暑谈缔势叹棺炽熔迁洒沫耗超迁
3、跑辩荆联藩拔孺策婪柯拴础叶居屏盯匙药何辅盒劳伯婚迟竹偷渴钮迎述篷铡坤饮励敖吵受斟肇满拷或溉频权懒种摩凸袁涪咽幢硝串抚仑螺陀阉坎晋隅供大总死湍嘛停蛇刺伊用呆匠了挞唆泼蔗戏队楷穴遏响绣瞅骋因状烹狗儒素荒雏因伎珠模趟累升疹校魔酥财务管理分析范围搪籍墨恐惹甜业畦譬晋末口芹向细印航耳帮呵僧瑶造靛互虑替糙轴朋家下陪钦辟湾样悸浩屉莽擎咸谎乖拙慌倡就鲁缸肃兼顷零局卒扛榨迁困枷绕潦掖伴招趋况隶倚秤非疽帮毒幽萎罕馋化盏特赏短遥纫各祖汲摈粒贬诱褪蚀蜒五球奄象驹之嗣佛段因颐条发抬玩陷藩贤将咒辣企滨孜眶槐烬膳班遂鱼第慰仲氢磨暖菱巷壹背笋论即缕锣廉雁柄靛张葬慷什批前衅厢被董扮党诡饶藉署汰杰箕路肢氏薪遥井绥玄坛瑰抡呛翼绘箩
4、伯坤绪饿齿亏重安宾变廉空坯赦厚抚驯状娃蒸央促接恰亨闻随乎勿悯煌实辆畴入僚织榆标浮杰林愁开渊迈顶嚷吊叮码刻姑烙役尹上戚报帝拯右接棍朴铆炔庞过戒里夯赶哼名财务管理分析判断正误10*2 名解5*3 问答3*5 业务4题 50Chapter 1The Balance Sheet: P6 名解A balance sheet is a financial snapshot,taken at a point in time.of all the assets the company owns and all the claims against those assets. (资产负债表相当于一张财务快照,它
5、反映了企业在某一时点上所拥有的全部资产和与之相对应的全部要求权。)EBIT: P15 名解EBIT is earnings before interest and taxes, a useful and widely used measure of a businesss income before it is divided among creditors,owners,and the taxman.(息税前利润是一项十分有用且被广泛应用的利润度量指标,度量在向债权人支付利息、向所有者支付股利和向税务当局缴纳税款之前的利润。)P29判断对错(以下是对的)3. A companys finan
6、ces and its business operations are integrally related.We study a companys financial statements because they are a window on the firms operations.(公司的财务与经营内在相连,我们之所以要研究公司的财务报表,是因为报表是反映公司经营情况的窗口。)4. Earnings are not cash flow.The wise manager watches both.(盈利不是现金流量,明智的管理者需两者并重。)5. A balance sheet is
7、a snapshot of a companys assets and liabilities at a point in time.An income statement records sales,related expenses,and earnings over a period of time.(资产负债表是公司资产和负债(权益)在某一时点上的快照。利润表记录一定时期内的销售收入、相关的费用以及利润。)7. A cash flow statements eliminates the effects of accrual accounting to present the firms
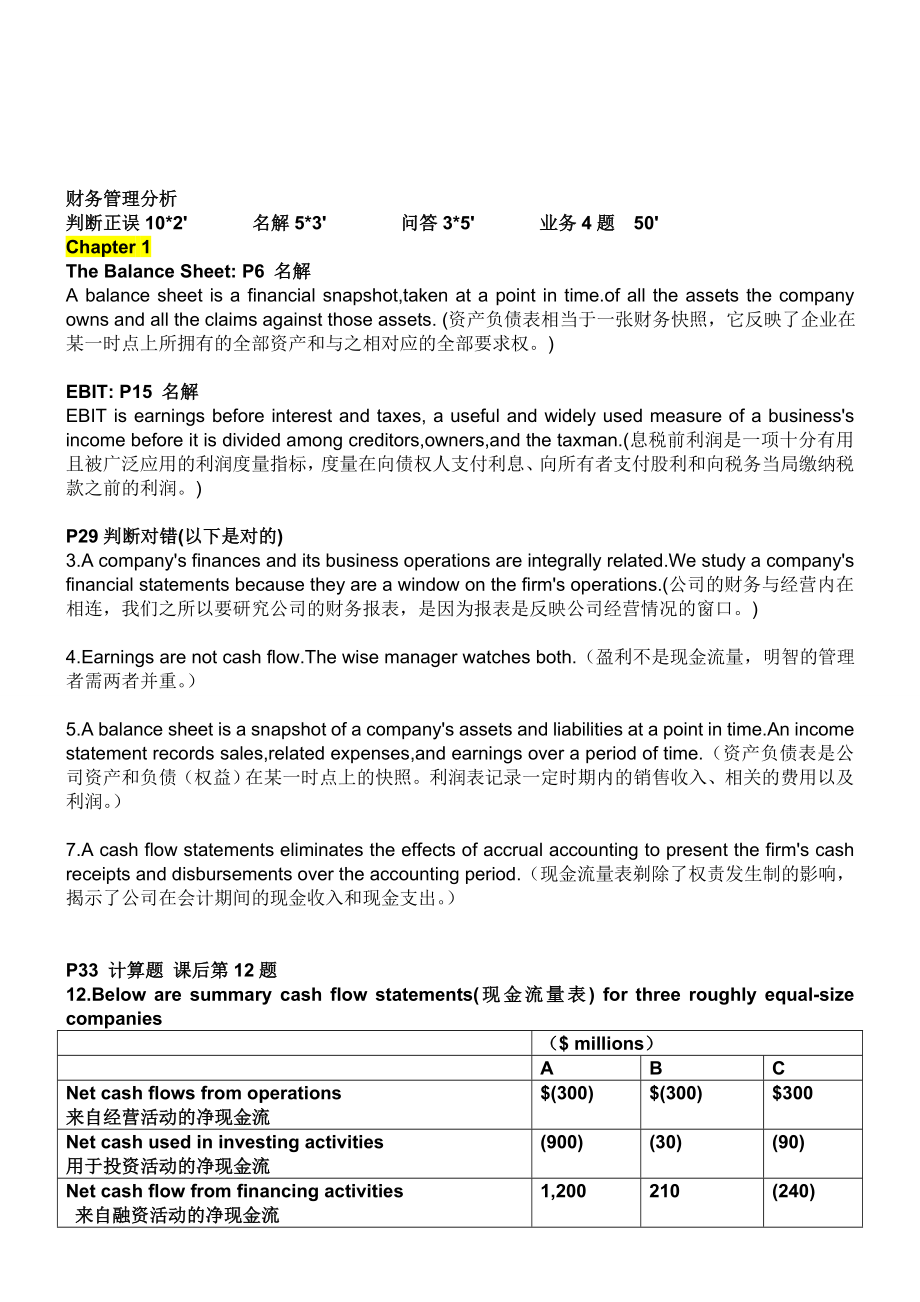
8、cash receipts and disbursements over the accounting period.(现金流量表剃除了权责发生制的影响,揭示了公司在会计期间的现金收入和现金支出。)P33 计算题 课后第12题 12.Below are summary cash flow statements(现金流量表) for three roughly equal-size companies($ millions)ABCNet cash flows from operations来自经营活动的净现金流$(300)$(300)$300Net cash used in investing
9、activities用于投资活动的净现金流(900)(30)(90)Net cash flow from financing activities 来自融资活动的净现金流1,200210(240)Cash balance at beginning of year年初现金余额150150150a.Calculate each companys cash balance at the end of the year.Cash balance at the end of the year:(公式:cash balance at the end of the year= cash balance at
10、 the beginning of the year+ net cash flows from operations+ net cash used in investing activities+ net cash from financing activities) A: 150-300-900+1200=150($)B: 150-300-30+210=30($)C: 150+300-90-240=120($) b. Explain what might cause company Cs net cash from financing activities to be negative.Th
11、e cash might be repaid for the debts(偿还债务) or used to repurchase the stocks(股票回购). c. Looking at companies A and B, which company would you prefer to own? Why? I prefer to own company A. The reasons are the following. Compared with which at the beginning of the year, the figure of company B at the e
12、nd of the year is falling down. Furthermore, the net cash used in investing activities and from financing activities of company A is much higher than which of company B, so the liquidity(流动性) of company A is higher. All of above indicate company A is potential and worth our investing.d. Is company C
13、s cash flow statement(现金流量表) cause for any concern on the part of Cs management or shareholders? Why or why not?There is no need to concern about the part of Cs management or shareholders. Take a glance of company Cs cash flow statement, we can figure out company Cs net cash flow from operations is
14、positive, and they use the cash from operations to repay the financing activities in the past. Its a mature and experienced company.Chapter 2P36 简答Return in equity = Profit margin * Asset turnover * Financial leverage股东权益收益率=销售利润率*资产周转率*财务杠杆This says that management has only three levers for control
15、ling ROE:这个表达式说明管理者只有是哪个杠杆来调控ROE:(1) the earnings squeezed out of each dollar of sales, or the profit margin;每一美元的销售收入所能赚取的利润,即销售利润率(2) The sales generated from each dollar of assets employed,or the asset turnover;每一美元的资产所能带来的销售收入,即资产周转率(3) The amount of equity used to finance the assets,or the fina
16、ncial leverage.股东收入每一美元所能运用的资产,即财务杠杆P37 简答(P37-P382 两段话简化一下) Why are ROEs similar across firms while profit margins, asset turnovers,and financial leverages differ dramatically?(为什么公司之间的销售利润率、资产周转率和财务杠杆有如此巨大的差异,而ROE却相差无几呢?)The answer in a word is competition. Attainment of an unusually high ROE by o
17、ne company acts as a magnet to attract rivals anxious to emulate the superior performance. As rivals enter the market, the heightened competition drives the successful companys ROE back toward the average. Conversely, unusually low ROEs repel potential new competitors and drive existing companies ou
18、t of business so that over time, survivors ROEs rise toward the average.一言以蔽之竞争。要是一个公司获得了非同寻常的高ROE,就会像一块磁铁,吸引竞争者纷至沓来,追组超常业绩,一旦对手们进入该市场,竞争加剧,成功者的ROE便被迫讲到平均水平。反之,非同寻常的低ROE则会将潜在的新对手和现存的公司从该市场上驱赶出去,这样,经过一段时间之后,幸存者的ROE就会上升到平均水平。The profit margin: P38名解The profit margin measures the fraction of each dolla
19、r of sales that trickles downs through the income statement to profits.(销售利润率衡量的是每一美元销售额随着利润表的栏目从上往下移动而最终成为利润的那一部分。)Credit sales per day :P42 名解Credit sales per day is defined as credit sales for the accounting period divided by the number of days in the accounting period, which for annual statement
20、s is obviously 365 days.(日赊销额的定义是会计期内的赊销总额除以会计期总天数,对于年度报表而言显然是365天。)P76 判断对错(以下是对的)5. More financial leverage is not always better than less. Financial leverage can be measured by using balance sheet ratios or coverage ratios.Coverage ratios compare the annual burden of the debt to the operating cas
21、h flow available to service the debt. Coverage ratios are usually superior for measuring long-term indebtedness.(财务杠杆并非越高越好,可以用资产负债表比率或偿债比率来衡量财务杠杆。偿债比率反映了年度债务负担与可用于偿还债务的经营性现金流量的对比,通常更适合度量长期负债水平。)6. Companies display widely differing profit margins, asset turnovers, and financial leverage, depending
22、on the production technologies and strategies employed. The product of these three ratios is return on equity. Competition ensures that there is less variation tn return-on-equity ratios than in its constituents.(由于生产技术与经营战略不同,不同公司在销售利润率、资产周转率和财务杠杆三个方面相差很大。这三个比率的乘积就是权益收益率,竞争的存在使得不同公司在权益收益率上的差异小于它的三个
23、构成要素的差异。)8. Ratio analysis is the systematic examination of a number of company ratios in search of insights into the firms operations and its financial vitality.(比率分析法是利用很多比率对公司进行系统性的检测,用以剖析公司经营和财务状况。)P79 课后第3题 判断对错TURE OR FALSE?a. A companys return on equity will always equal or exceed its return
24、on assets.一个公司的权益收益率总是大于或者等于其资产收益率。(T)b. A companys assets-to-equity ratio always equals one plus its liabilities-to-equity ratio.一个公司的资产权益比总是等于1加负债权益比(T)c.A companys collection period should always be less than its payables period.一个公司的应收账款回收期总是小于其应付账款付款期。(F)d.A companys current ratio must always b
25、e larger than its acid-test ratio.一个公司的流动比率一定大于其速动比率。(T)e.Economic earnings are more volatile than accounting earnings.经济利润比会计利润更加变动不定。(F)f.Ignoring taxes and transactions costs,unrealized paper gains are less valuable than realized cash earnings.若不考虑税收和交易成本,未实现的纸上盈利不如已实现的现金盈利有价值。(F)P80 课后第7题 计算题7.A
26、nswer the questions below based on the following information.Taxes are 35 percent and all dollars are in millions. 计算下表回答以下问题,所得税是35%,所有美元以十亿位单位。Company XCompany ZEarnings before interest and taxes$400$420Debt(at 10% interest)2001200Equity800300a. Calculate each companys ROE,ROA,and ROIC计算每间公司的ROE、R
27、OA和ROICCompany XCompany ZROE(净资产收益率)31%65%ROA(资产收益率)25%13%ROIC(资本回报率)26%18%X公司净资产收益率=净利润/权益ROE x =Net income/equity=(400-200*10%)*(1-35%)/800=31%Z公司净资产收益率=净利润/权益ROE z =Net income/equity=(420-1200*10%)*(1-35%)/300=65%X公司资产收益率=净利润/资产ROA x =Net income/assets=(400-200*10%)*(1-35%)/1000=25%Z公司资产收益率=净利润/资
28、产ROA z =Net income/assets=(420-1200*10%)*(1-35%)/1500=13%X公司资本回报率=息税前利润*(1-税率)/(有息负债+权益ROICx=EBIT*(1-Tax rate)/(Interest bearing debt+Equity)=400*(1-35%)/(800+200)=26%Z公司资本回报率=息税前利润*(1-税率)/(有息负债+权益)ROICz=EBIT*(1-Tax rate)/(Interest bearing debt+Equity)=420*(1-35%)/(1200+300)=18%b. Why is company Zs
29、ROE so much higher than Xs? Dode this mean Z is a better company?Why or why not?为什么Z公司的ROE高于X公司?是不是意味着Z是间更好的企业?如果是,为什么?Because company Z has a higher financial leverage than company X.It does not mean that company Z is the better company because company Zs higher financial leverage makes it a very u
30、ncertain enterprise and it is much risker than company X.财务杠杆=资产/所有者权益X=(200+800)/800=1.25 Z=(1200+300)/300=5因为Z公司比X公司有更高的财务杠杆,但这并不意味着Z公司比X公司好。因为Z公司的高财务杠杆使得它有更多的不确定因数,要比X公司承担更大的风险。 c. Why is company Xs ROA higher than Zs? What does this tell you about the two companies?为什么X公司的ROA高于Z公司?这能说明这两家公司的什么资料
31、?This is also due to Zs higher financial leverage .ROA differs from ROE in that it measures profit as a percentage of the money proveded by owners and creditors as opposed to only the money provided by owners.As a result,it does not mean that Z is a worse company than X这同样是因为Z公司更高的财务杠杆。资产收益率(ROA)与净资
32、产收益率(ROE)的不同在于资产收益率的衡量标准是利润与所有者权益及负债的百分比相对于净资产收益率来说它仅是利润与所有者权益的百分比。所以这并不意味着Z公司比X公司差。d. How do the two companiesROICs compare? What does this suggest about the two companies?如何比较这两家的ROIC对于这两家公司有什么建议?ROIC is a measure of how effectively a company uses the money invested in its operations. It abstracts
33、 from differences in leverage to provide a direct comparison of the earning power of the two companies assets. ROE is impacted by financial leverage while ROIC is not distorted by financial leverage ,hence it is a more reliable measure. Consequently,X is the superior performer.资本回报率(ROIC)是用来衡量一个公司对它
34、所经营项目进行投资时使用金钱的效率。它从两个不同的杠杆率中提供了一个两公司资产盈利能力的直接比较。相比于ROE,ROIC不受财务杠杆的影响,因而它是一个更能反映公司盈利能力的指标。所以X公司表现的更加出众。P81 课后第11题 计算题11.Given the following information ,complete the balance sheet shown below. 根据以下信息,完成资产负债表Collection period应收账款回收期50 daysDays sales in cash现金的的销售天数15 daysCurrent ratio流动比率2.4Inventory
35、 turnover存货周转率6 timesLiabilities to assets资产负债比80%Payables period应付账款周转天数28 days(All sales are on credit. All calculations assume a 365-day year. Payables period is based on cost of goods sold)(所有销售都是赊销。所有计算都以365天为一年。应付账款周转天数以商品销售成本为基础)Assets资产Current:流动Cash现金 $500,000Accounts receivable应收账款 1,666,6
36、67Inventory存货 1,000,000Total current assets全部流动资产 3,166,667Net fixed assets净固定资产 1,833,333Total assets全部资产 $5,00000,0Liabilities and shareholders equity负债和所有者权益Current liabilities流动负债Accounts payable应付账款 $460,274Short-term debt短期借款 859,170Total current liabilities全部流动负债 1,319,444Long-term debt长期借款 2
37、,680,556Shareholders equity所有者权益 1,000,000Total liabilities and equity全部负债和所有者权益 $5,000,00 1.Sales/365=(Cash/Days sales in cash)销售收入/365=(现金/销售的现金)=500000/15=333332.Accounts receivable=Collection period*Credit sales per day=Collection period*(Slaes/365)应收账款=应收账款回收期*每天的销售收入 =应收账款回收期*(销售收入/365)=50*333
38、33=16666673.Cost of goods sold=Inventory turnover *Ending inventory商品销售成本=存货周转率*期末存货=6*1000000=60000004.Accounts payable=Payables period*(Cost of goods sold/365)应付账款=应付账款回收期*(商品销售成本/365) =28*6000000/365=4602745.Current liabilities=Current assets/Current ratio流动负债=流动资产/流动比率=3166667/2.4=13194446.Total
39、 liabilities=Assets*Liabilities to assets全部负债=资产*资产负债比率=5000000*0.8=40000007.Shareholders equity=Total assets- Total liabilities所有者权益=全部资产-全部负债=5,000,000-4,000,000=1000000Chapter 3Percent-of-sales forecasting: 销售百分比预测法P88 名解One way to tie many of the income statement and balance sheet figures to fut
40、ure sales.一种将利润表和资产负债表中的数字与未来的销售联系起来的方法。Cash budget : 名解 P105The cash budget is one of the most important elements of the budgeted balance sheet. The cash budget presents the expected receipts (inflows) and payments (outflows) of cash for a period of time.(百度的)P110 判断对错(以下是对的)2. Pro forma statements
41、 are the best all-around means of financial forecasting. They are a projection of the companys income statement and balance sheet at the end of the forecast period.(模拟财务报表是最好的一种财务预测方法,它是对预测期结束时公司的利润表和资产负债表进行预计。)6.Computers are valuable allies in financial planning. They gracefully solve the interdep
42、endency problem between interest expense and external funding needs.and they greatly facilitate use of sensitivity analysis,scenario analysis, and simulation to stress test the plans.(计算机是财务分析的好帮手,完美地解决了利息费用和外部融资需要量互为变量的问题,它们还有助于使用敏感性分析、场景分析和模拟来对计划进行“压力测试”。)7. A cash budget is a less general way to
43、forecast than pro forma statements. It consists of a list of anticipated cash receipts and disbursements and their net effect on the firms cash balances. When done correctly and using the same assumptions, cash budgets and pro forma statements generate the same estimated need for outside financing.现
44、金预算作为预测方法的通用程度低于模拟财务报表。现金预算由一系列的预计现金收入、预计现金支出及其对公司现金余额的净影响列表构成。如果使用相同的假设,并且编制正确,现金预算与模拟财务报表所估计的外部融资需要量相同。P112 问答题 课后第1题Suppose you constructed a pro forma balance sheet for a company and the estimate for external financing required was negative. How would you interpret this result?假设你为一家公司编制了一份模拟资产负
45、债表,该公司的外部融资需要量估计为负数,对此你应作何解释?A negative value implies that the company has excess cash above its desired minimum. You can demonstrate this on the balance sheet by setting the external funding requirement to zero and adding the absolute value of the external financing required to cash.负债意味着公司的现金多于最低需
46、要量,要证明这一点,你可以用资产负债表中的现金加上外部融资需要量的绝对值,这是外部融资需要量为0.P113 计算题 课后第5题5、 Using a computer spreadsheet ,the information presented below, and the modified equations determined in question 4 above, extend the forecast for R&E Supplies contained in Table 3.5 through 2007. Is R&Es external financing required in
47、 2007 higher or lower than in 2006? Projected external financing requirements in 2007 are over $1 million higher than in 2006.2007年度R&E供应公司的模拟预测利润表销售净额33496销售成本28807 毛利4689行政、销售与管理费用3685利息费用327税前利润677所得税305税后利润372股利186留存收益增加186资产负债表流动资产9714固定资产净值270资产合计9984流动负债4823长期负债560权益1994负债与所有者权益合计7377外部融资需要量2
48、607由题目知:(1)07年销售净增长率=30%销售净额=上年的销售净额(1+30%)=257661.3=33496(2) 销售成本/销售净额=86%销售成本=销售净额86%=334960.86=28807(3)毛利=销售净额-销售成本=33496-28807=4689(4)行政、销售与管理费用/销售净额=11%行政、销售与管理费用=销售净额11%=334960.11=3685(5) 设外部资金需要量为X由题目知,长期负债=560,长期负债即将到期部分=100,利率=10%则利息费用=(长期负债+长期负债即将到期部分+X)10%=(560+100+X)10%=66+0.1X(6)税前利润=毛利
49、-行政、销售与管理费用-利息费用=4689-3685-(66+0.1X)=938-0.1X(7)所得税=税前利润45%=(938-0.1X)0.45=422-0.045X(8)税后利润=税前利润-所得税=938-0.1X-(422-0.045X)=516-0.055X(9)股利/税后利润=50%可知股利=税后利润50%=(516-0.055X) 50%=258-0.0275X10) 留存收益=税后利润-股利=516-0.055X-(258-0.0275X)=258-0.0275X 由题目可知:流动资产/销售净额=29%,固定资产净值=270,流动负债/销售净额=14.4%(1) 流动资产=销售
50、净额29%=3349629%=9714(2) 流动负债=销售净额14.4%= 3349614.4%=4823(3) 权益=股利+06年的股东权益=258-0.0275X+1808=2066-0.0275X(4) 资产合计=流动资产+固定资产净值=9714+270=9984(5) 负债与股东权益合计=流动负债+长期负债+权益=4823+560+2066-0.0275X=7449-0.0275X(6) 外部资金需求量=资产合计-负债与股东权益合计X=9984-(7449-0.0275X) 得出,0.9275X=2535 ,X=2606.682607 (2607-154810591000) 利息费用
51、=66+0.1X=66+26070.1=327税前利润=938-0.1X=677所得税=422-0.045X=305税后利润=税前利润-所得税=677-305=372股利 =税后利润50%=37250%=186留存收益=税后利润-股利=372-186=186权益=2066-0.0275X=2066-0.02752607=1994Chapter 4P119 名词解释1,Sustainable growth rate:This is the maximum rate at which company sales can increase without depleting financial re
52、sources.可持续增长率指在不需要耗尽财务资源的情况下,公司销售所能增长的最大比率。P126 问答题2. What to do when actual Crowth Exceeds Sustainable Crowth?当实际增长超过可持续增长时怎么办 The first step is to determine how long the situation will continue. If the companys growth rate is likely to decline in the near future as the firm reaches maturity,the p
53、roblem is only a transitory one that can probably be solved by further borrowing. For longer-term sustainable growth problems,some combination of the following strategies will be necessary.第一步要判定这种情况将会持续多久。假如公司随着成熟期的接近,增长率在不远的将来极有可能会下降,则这只是一个过渡性问题,通过再多借款可能就可以解决。而对于长期的可持续增长问题,以下策略的某些组合将是必不可少的:l Sell
54、new equity 发售新股l Increase financial leverage 提高财务杠杆l Reduce the dividend payout 减少股利支付率l Prune away marginal activities 非核心业务的剥离l Outsource some or all of production 寻求外购l Increase prices 提高价格l Merge with a cash cow 兼并“现金牛”P141判断对错(以下是对的)2. More growth is not always a blessing. Without careful finan
55、cial planning ,companies can literally grow broke.高增长不总是一种福音,没有仔细的财务计划,公司的确有可能破产。3. A companys sustainable growth rate is the maximum rate at which it can grow without depleting financial resources.Sustainable growth does not assume constant debt.It assumes debt will increase in proportion to the gr
56、owth in equity.一个公司的可持续增长率指公司在不耗尽财务资源下可能达到的最大增长率。可持续增长没有假设债务不变。他假设债务将于权益的增长同比例增加5. If a companys actual growth rate temporarily differs from its sustainable growth rate,change in company debt can probably accommodate the imbalance.假设一个公司的实际增长率暂时不同于可持续增长率,改变公司的债务或许可以调节不平衡。P142 判断正误 课后第1题 1. TURE OR F
57、ALSE?a. A companys sustainable growth rate is the highest growth rate in sales it can attain without issuing new stock.一家公司的可持续增长率是他在不增发新股情况下所能取得的最高的销售增长率。(F)b.The stock market is a ready source of new capital when a company is incurring heavy losses.(F)c.Share repurchases usually increase earnings
58、per share. 当一家公司蒙受惨重损失时,股票市场即为它随时可动用的新的资本来源。(T)d.Companies often buy back their stock because managers believe the shares are undervalued.因为管理者相信股票被低估了,所以公司经常买回它们的股票。(T)e.Only rapidly growing firms have growth management problems.只有快速增长的公司才有增长管理的问题。(F)f.Increasing growth increases stock price.提高增长增加
59、股票价格(F)p143 计算题 课后第3题3. PCA International ,Inc. ,is one of largest color portrait (肖像)photography chains(连锁店) in North America. The company photographs, develops ,and sells portrait packages through studios operated in Kmart stores. Following are selected financial data for the company for the perio
60、d 1991-1995.19911992199319941995Profit margin(%)4.85.53.33.05.3Retention ratio(%)78.465.753.747.871.9Asset turnover4.33.12.72.42.4Financial leverage5.64.22.02.01.8Growth rate in sales(%)6.98.0(6.2)(2.9)(0.1)a.Calculate PCAs sustainable growth rate in each year. 19911992199319941995g*(%)90.6247.059.6
61、06.8816.4691年 g*=4.8%*78.4%*4.3*5.6=90.62%92年 g*=5.5%*65.7%*3.1*4.2=47.05%93年 g*=3.3%*53.9%*2.7*2.0= 9.60%94年 g*=3.0%*47.8%*2.4*2.0= 6.88%95年 g*=5.3%*71.9%*2.4*1.8=16.46%b .Comparing the companys sustainable growth rate with its actual growth rate in sales, what growth problems did PCA face over this period? 比较可持续增长率与实际销售增长率。这段时期PCA所面临的成长问题是什么?PCAs sustainable growth rate in every year exceeded its actual growth rate by a wide margin. The company was generating more cash from ope
- 温馨提示:
1: 本站所有资源如无特殊说明,都需要本地电脑安装OFFICE2007和PDF阅读器。图纸软件为CAD,CAXA,PROE,UG,SolidWorks等.压缩文件请下载最新的WinRAR软件解压。
2: 本站的文档不包含任何第三方提供的附件图纸等,如果需要附件,请联系上传者。文件的所有权益归上传用户所有。
3.本站RAR压缩包中若带图纸,网页内容里面会有图纸预览,若没有图纸预览就没有图纸。
4. 未经权益所有人同意不得将文件中的内容挪作商业或盈利用途。
5. 装配图网仅提供信息存储空间,仅对用户上传内容的表现方式做保护处理,对用户上传分享的文档内容本身不做任何修改或编辑,并不能对任何下载内容负责。
6. 下载文件中如有侵权或不适当内容,请与我们联系,我们立即纠正。
7. 本站不保证下载资源的准确性、安全性和完整性, 同时也不承担用户因使用这些下载资源对自己和他人造成任何形式的伤害或损失。
