 牛顿环实验报告英文版

《牛顿环实验报告英文版》由会员分享,可在线阅读,更多相关《牛顿环实验报告英文版(19页珍藏版)》请在装配图网上搜索。
1、Newtons Rings(Caution: the report still have some mistakes inevitably.)1. Purpose of the experimenta) Applying Newtons rings to observe the phenomenon of equal thickness interference with reflected light and transmitted light respectively, then analyze the physical principles.b) Get familiar with im
2、age processing and learn to use software concerned, such as Image J and Visio.c) Analyze reasons for different patterns resulted from different light sources.2. Apparatusa) Sodium lamp (with a central wavelength of 589.3nm)b) Other illuminant (purple, white and red leaser)c) Newtons ringsd) Imaging
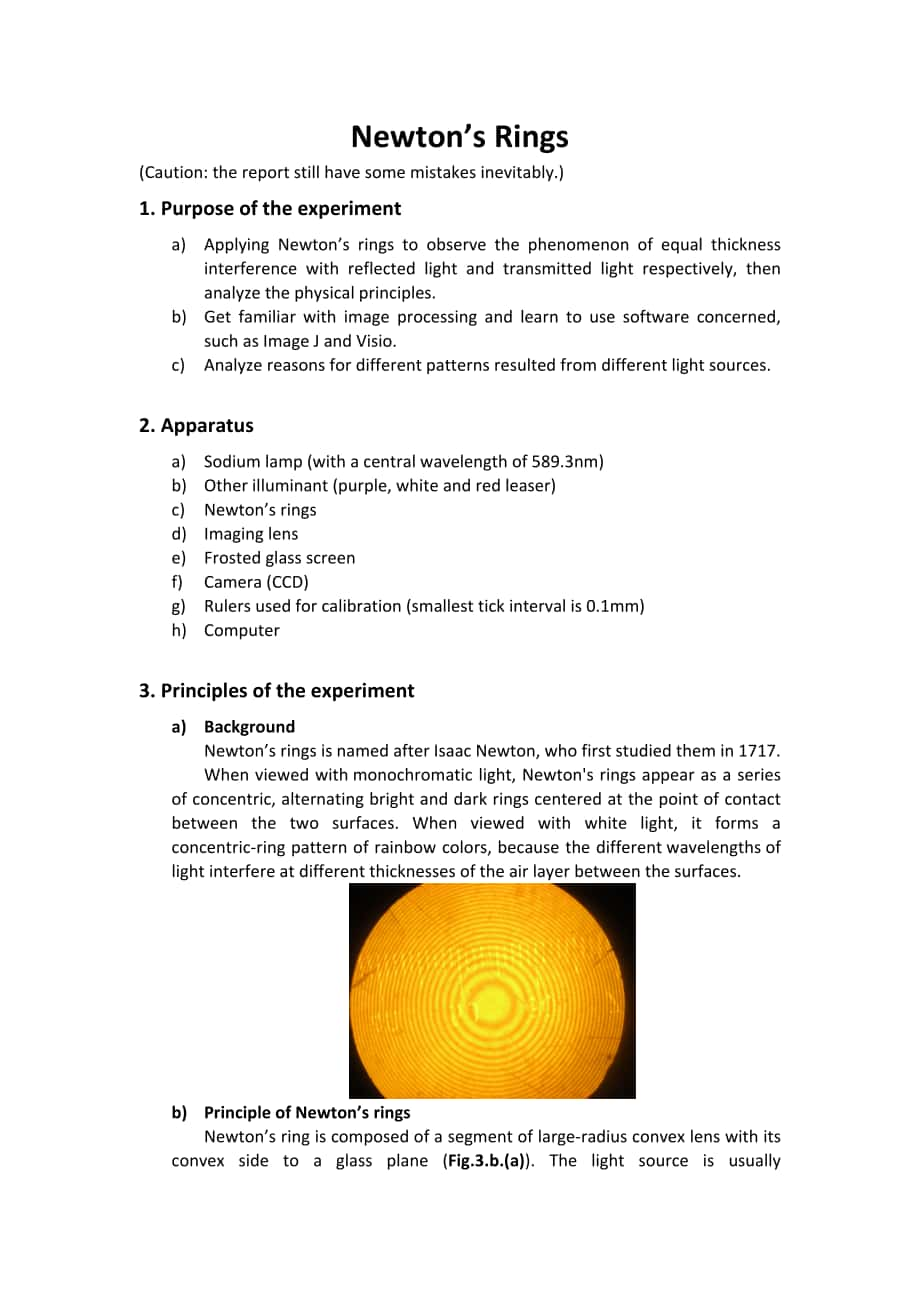
3、lense) Frosted glass screenf) Camera (CCD)g) Rulers used for calibration (smallest tick interval is 0.1mm)h) Computer3. Principles of the experimenta) BackgroundNewtons rings is named afterIsaac Newton, who first studied them in 1717. When viewed withmonochromatic light, Newtons rings appear as a se
4、ries of concentric, alternating bright and dark rings centered at the point of contact between the two surfaces. When viewed with white light, it forms a concentric-ring pattern of rainbow colors, because the differentwavelengthsof light interfere at different thicknesses of the air layer between th
5、e surfaces.b) Principle of Newtons ringsNewtons ring is composed of a segment of large-radius convex lens with its convex side to a glass plane (Fig.3.b.(a). The light source is usually monochromatic light. Because of the gap between the plane lens and the convex lens, the reflected ray and the inci
6、dent ray will have opticalpathdifference. As a result the two rays will interfere with each other. The whole process is called equalthicknessinterference, which is one type of film interference. When two beams interfere with each other, there will be a superposition of waves due to the characterizat
7、ion of light waves. If the opticalpathdifference s is integral multiple of the wavelength , i.e., the superposition will cause the maximum amplitude and result in the brightest region of the image on the screen. On the other hand, if the opticalpathdifference s is integer and a half multiple of the
8、wavelength, the two beams will counteract each other and result in the dark region of the image on the screen (Fig.3.b.(b). The air film between the convex lens and glass plane is curved instead of uniform, so the rings on the pattern is not uniformly distributed. Further, we apply sodium lamp for t
9、he expand surface light source. The advantage is that there are numerous wave vectors and the interference area is small, thus the interference will be localized. Fig.3.b. (a) The structure of a Newtons ring (b) The pattern of Newtons rings c) Half-wave lossWhen a wave transfers from wavethinnermedi
10、um to a wave densermedium and reflected back, the reflected wave has the vibrating direction half period later than the incident wave. Such phenomenon is called half-wave loss. d) The meaning of the patternFrom (b) we can see, the two beams causing one bright ring have the opticalpathdifference wher
11、e d is the thickness of the air film. For dark rings, . Considering the half-wave loss when the beam reflect on the glass plane, to dark rings we haveThe thickness of the air film between the glass plane and the convex lens as shown in Fig.3.b. (a) can be calculated From (1) and (2) we haveEquation
12、(3) is the main equation for the data analysis below.If pressure is applied to the contact point of the lens and the glass plane, a small distortion d0 should be introduced as correction into expression(2), givingd=r2/2R-d0 ( r2=2R-d0 ).(4)For dark fringes, expression (3) becomesr2=kR+2Rd0.(5) k=0,
13、1 ,2 ,3Similar analysis can be applied to the Newtons rings in transmitted light, which has a bright central spot. For the bright fringes in transmitted light, r2=kR.(6)k=0, 1 ,2 ,3(bright fringes)Expression (3) and (6) indicate that the radius of the dark Newtons rings in reflected light equals to
14、the radius of the bright Newtons rings in transmitted light, which means these two sets of interference pattern are complementary. The visibility of the fringes in reflected light is different from that in transmitted light. The amplitude reflection coefficient is r when the light travels from the a
15、ir to the glass, and the amplitude transmission coefficient is t. According to Stokes relations, the amplitude reflection coefficient is r when the light travels from the glass to the air, and the amplitude transmission coefficient is t, which satisfies tt+r2=1. The visibility V is defined as V=(Ima
16、x-Imin)/(Imax+Imin), in which Imax and Imin are the maximum and minimum light intensity respectively in the interference pattern. From simple calculation we can get Expression (7) indicates that the visibility is related to r. In our experiment, the refraction index of the air and the glass is respe
17、ctively n1=1.0, n2=1.55, giving r=(n2-n1)/(n2+n1)=0.22. Use this value of r in (7), we get Vtran approximately 10 percent, and Vref approximately 100 percent. Therefore in this experiment we use the image of Newtons rings in reflected light to measure the radius of curvature R of the plano-convex le
18、ns.e) Point to Point imaging and image enlargementThe Newtons rings are generally too small for direct observation and measurements, hence usually reading microscope is applied to observe and measure them. When illuminated with expanded plane light source, the Newtons rings are localized interferenc
19、e pattern of equal thickness, so we can consider the fringes as the object, and use lens to get its image on the screen, which can be image sensor on the camera. The photosensitive surface of this image sensor is usually called the target surface. There is a variety of working mechanisms of this kin
20、d of sensor. One of the most commonly applied image sensors is CMOS image sensor.Usually the target surface is the integration of hundred thousands or millions of photoelectric sensors. Each photoelectric sensor is named as a pixel, and its function is to translate the light intensity its area into
21、electric signals. These signals are translated by electric circuits into digital coding, transferred to the computer, and then point-to-point displayed by certain software. Point-to point means that one pixel on the target surface corresponds to one pixel on the computer screen where the processed i
22、mage is displayed. This widely applied method makes observation and precise measurement convenient, but it does not enhance the resolution of the image, which depends primarily on the amplification coefficient of the optical system, the quality of the image and the pixel density on the target surfac
23、e.When we take a photograph, large aperture size, which gives lower depth of focus, can be used to achieve blurring at the adjacent area of the image surface and highlight on the object. Therefore during the experiment we should adjust the aperture carefully to a proper size that improves the image
24、quality.f) The reduction of the random noise of the imageAccording to the theoretical background about the Newtons rings discussed earlier in this section, while the visibility of the fringes in reflected light is high, the light intensity on the target surface would be weak since the beams are tran
25、smitted backwards from the device, resulting in strong influence on the image from the background noise of the sensor. If we observe carefully we would find small randomly moving or twinkling spots on the displayed image, called the random noise of the image. It appears randomly, which allows us to
26、reduce it through performing arithmetic average over time, which is, taking multiple photos when all the experimental conditions are kept unchanged, and calculating point-to-point arithmetic mean of these photos, which gives a higher quality image. g) Calibration and measurementsBecause of the inevi
27、table frequent adjustments to the optical path, it is hard to keep the optical elements at fixed positions, rendering it difficult to directly calculate the magnification coefficient. If we use a ruler with known scale length in the place of the object, we can get the magnification coefficient throu
28、gh their comparison. This method is named as the calibration of the system. In this way, the measurement of the pixels can substitute for the measurement of the geometric size of the object. Facilitated by the computer, images of objects with complex geometry can be processed through this way. 4. Pr
29、ocedure of the experimenta) Observe and record Newtons rings in transmitted lighti. Use your eyes to observe Newtons rings in reflected and transmitted white light. Pay specific attention to the pattern of the 0th order ring and the size of the rings. If it is not in the center of the device, then f
30、urther adjustments are required. Estimate the ratio between the image distance and the object distance from the size of the rings and the size of the target surface of the camera.1.Sodium lamp; 2.lens; 3.Newtons ring; 4.lens; 5.CCD; puter systemFig.4 the optical path diagram of the experimentii. Arr
31、ange the optical elements for observation of the fringes in transmitted light according to the optical path diagram illustrated in Fig.4. Adjust the aperture size of the imaging lens to the largest value.iii. Adjust the optical elements to concentric and equal-altitude position. First, draw the opti
32、cal elements close to roughly adjust them to be concentric and on the same altitude. Then adjust them until they meet this requirement precisely, using the method the small image followed by the large image.iv. Adjust the ratio between the image distance and the object distance to get sharp image wi
33、th proper size and with a bright 0th order spot. Adjust this ratio so that the 3rd to 10th ring area is the sharpest. v. Adjust the aperture of the imaging lens, and observe the resolution change of the whole image of Newtons rings. Adjust it so that the panorama view of the rings is the sharpest, a
34、nd prevent the saturation of brightness in the brightest area.vi. Fix the position of the device of Newtons rings, the lens and the camera, and adjust the parameters in the video software. Record after satisfactory image quality is achieved. More detailed procedure of this step is available in The N
35、ewtons rings experiment software users Manual. b) Observe and record Newtons rings in reflected lighti. Keep the image distance and the object distance constant. Arrange the optical path for the observation of the fringes in reflected light as illustrated in Fig.4. Add a plate-glass between the Newt
36、ons rings and the lens, and adjust the angle between the optical axis and the plate-glass to be approximately 45. Move the sodium lamp so that the light illuminates the plate-glass and reflects vertically to travel to the Newtons rings. Newtons rings in reflected light with a dark 0th order spot sho
37、uld appear on the computer screen. In the mean time, adjust the position of the device to make the 0th order spot center the image. ii. Turn the aperture size to the largest value, and adjust the position of the Newtons rings device precisely to acquire sharpest image in the 3rd to 10th ring area. A
38、fter that, adjust the aperture size to proper value.iii. Adjust the parameters in the video software to get satisfactory image quality. Due to the low intensity of the reflected light, the image noise will be bigger in this step. Therefore keep the recording conditions unchanged, and take 10 photogr
39、aphs, or record a video that lasts approximately 5 seconds. c) Record the image for calibrationi. Since the ticks on the ruler is not transparent, the image of the fringes in transmitted light will have better quality than that in reflected light. Keep the image distance constant, move away the Newt
40、ons rings and the plate-glass, and put the ruler on the object plane.ii. Turn the aperture size to the largest value. Move the ruler back and forth, and fix its position precisely. Then adjust the aperture size again to get sharp image. In the mean time, the amplification of the entire optical path
41、should be the same as when the Newtons rings are recorded. Record the image of the ruler.d) Newtons rings in polychromatic lightUse the tricolored LED light as the light source to record the fringes in reflected light. The monochromatic light can be chosen as R, G and B, and bi-chromatic light can b
42、e chosen as R-G, G-B, G-B or R-G-B. White LED light or the work lamp can be used as the light source in the recording as well.i. Compare the regions in which the interference orders are sharp when the sodium lamp and the three kinds of LED monochrome are used as the light source respectively.ii. Int
43、erpret the change of the interference orders in the bi-chromatic light.5. Dataa) Sodium lightThe wave length of the sodium light is 589.0 nm and 589.6 nm, and we choose the mean wavelength 589.3 nm, the reason of which will be illustrated in discussion. With transmission-type method (Fig.5.(a).1), t
44、he figure we attain is not very clear for further analysis. Fig.5.(a).1.The pattern attained by transmission-type methodSo we apply the reflection-type method (Fig.5.(a).2)Fig5.(a).2.The pattern attained by reflection-type methodAfter processed by Visio we can have the radius of each ring (Fig.5.(a)
45、.3).Fig5.(a).3.The image after processThe diameters of the 10th to 24th rings are shown in the table below:198.624 207.136 214.505 221.953 229.067 236.191 243.390 250.263 256.734 263.038 269.310 275.220 281.395 287.487 293.188 Then we process the image of ruler (Fig.5.(a).4)Fig.5.(a).4.The processed
46、 image of the rulerFrom the figure we can get the distance between 2mm is 80.71 units.b) Purple lightWe apply the reflection-type method (Fig.5.(b).1)Fig.5.(b).1.The pattern attained by reflection-type method after processBecause the rings far from the center is not clear enough for analysis, we cho
47、ose 4th to 13th rings, whose diameters are shown in the table below:67.93373.72879.45784.4889.48594.00398.184102.435106.323109.954Then we process the image of ruler (Fig.5.(b).2)Fig.5.(b).2.The processed image of the rulerFrom the figure we can get the distance between 2mm is 91.50 units.c) Red ligh
48、t We apply the reflection-type method (Fig.5.(c).1)Fig.5.(c).1.The pattern attained by reflection-type method after processThe diameters of the 1st to 10th rings are shown in the table below:51.10763.60674.26883.61591.93999.929105.812112.067118.216123.177Then we process the image of ruler (Fig.5.(c)
49、.2)Fig.5.(c).2.The processed image of the rulerFrom the figure we can get the distance between 2mm is 91.04 units.d) White lightFor white light is not monochromatic light, so we just choose two kinds of colors - purple and yellow, then we apply the reflection-type method (Fig.5.(d).1&2)Fig.5.(d).1.T
50、he pattern of purple rings attained by reflection-type method after processFig.5.(d).2.The pattern of yellow rings attained by reflection-type method after processThe diameters of the 1st to 4th rings are shown in the table below:purplek1234D48.51759.61968.04676.55yellowk1234D43.12955.25164.88973.20
51、5Then we process the image of ruler (Fig.5.(d).2)Fig.5.(d).2.The processed image of the rulerFrom the figure we can get the distance between 2mm is 55.44 units.6. Data analysisa) Sodium light:The data concerned is shown in the table below.k11121314151617k(mm)0.0070740.00766350.0082530.00884250.00943
52、20.01002150.010611r(mm)2.46096 2.56642 2.65773 2.75001 2.83815 2.92642 3.01561 r2(mm2)6.05632 6.58653 7.06350 7.56253 8.05509 8.56391 9.09391 18192021222324250.01120050.011790.01237950.0129690.01355850.0141480.01473750.0153273.10077 3.18094 3.25905 3.33676 3.40999 3.48649 3.56197 3.63261 9.61476 10.
53、1184 10.6214 11.1340 11.6280 12.1556 12.6877 13.1959 Then we can apply Origin to draw the figure of d2 and kWe can learn from the figure that the radius of the convex lens is We also apply MATLAB to analyze the data, the result is shown below and the code is attached in the appendix. We can see the
54、result is The difference is because the Origin result is the slope of the d2-k, while the MATLAB result is the radius calculated respectively. We think the latter is more precise and apply the result afterwards. b) Purple lightThe data concerned is shown in the table below.k45678910111213kR(mm)3431.
55、64289.55147.46005.36863.27721.185799436.910295 11153 r(mm)1.4849 1.6115 1.7368 1.8466 1.9560 2.0547 2.1461 2.2390 2.3240 2.4034 r2(mm2)2.2049 2.5971 3.0164 3.4098 3.8258 4.2218 4.6057 5.0132 5.4010 5.7762 Then we can apply Origin to draw the figure of d2 and kRWe can conclude from the figure that th
56、e slope is the wavelengthc) Red lightThe data concerned is shown in the table below.k12345678910kR(mm)857.91715.82573.73431.64289.55147.46005.36863.27721.18579r(mm)1.1227 1.3973 1.6315 1.8369 2.0197 2.1953 2.3245 2.4619 2.5970 2.7060 r2(mm2)1.2605 1.9525 2.6619 3.3741 4.0794 4.8192 5.4034 6.0611 6.7
57、445 7.3224 Then we can apply Origin to draw the figure of d2 and kRWe can conclude from the figure that the slope is the wavelengthd) White light Because there are only 4 sets of data, we choose MATLAB to analyze the data in order to get more precise result. (The code is attached in the appendix)We
58、can conclude from the result that the wavelength of purple and yellow light are7. Conclusion and discussiona) Question 1: Derive the interference condition for the dark fringes in transmitted light and for the bright fringes in reflected light.Sol:Fig 7.1.(a) The structure of a Newtons ring (b) The
59、pattern of Newtons ringsFrom Fig 7.1 we can learn the thickness of the air film is Because dr,R, d2 is small enough to be neglected compared to other prts of the equation. We can get.Considering the half-wave loss when the beams reflect on the glass plane and finally form dark fringes. The opticalpa
60、thdifference, is and at the same time. So we can have Similarly, the form of bright fringes isb) Question 2: For the same experimental device, what are the differences and similarities between the fringes in transmitted light and the fringes in reflected light?Sol: Fig 7.2.Patterns attained by trans
61、mission-type method (left) and by reflection-type method (right)As is shown in Fig 7.2, the pattern we get from reflected light is much more clear than that from transmitted light. The reflection-type method leads to the darker and kind of larger fringes mainly because of the half-wave loss. Also du
62、e to the half-wave loss, the center part are bright and dark respectively in the two method.As to similarities, the distribution of fringes is almost the same, both wider near the center and thinner near the edge. This is based on the same principle of the formation - interference.c) Question 3: What is d0 in expression (4)?Sol:d0 is a small distortion if pressure is applied to the contact point of the lens and the glass plane. In such case, the thickness is actually smaller than the d we calculated, i.e. d) Question 4: What are the differences between the interference pattern in reflected l
- 温馨提示:
1: 本站所有资源如无特殊说明,都需要本地电脑安装OFFICE2007和PDF阅读器。图纸软件为CAD,CAXA,PROE,UG,SolidWorks等.压缩文件请下载最新的WinRAR软件解压。
2: 本站的文档不包含任何第三方提供的附件图纸等,如果需要附件,请联系上传者。文件的所有权益归上传用户所有。
3.本站RAR压缩包中若带图纸,网页内容里面会有图纸预览,若没有图纸预览就没有图纸。
4. 未经权益所有人同意不得将文件中的内容挪作商业或盈利用途。
5. 装配图网仅提供信息存储空间,仅对用户上传内容的表现方式做保护处理,对用户上传分享的文档内容本身不做任何修改或编辑,并不能对任何下载内容负责。
6. 下载文件中如有侵权或不适当内容,请与我们联系,我们立即纠正。
7. 本站不保证下载资源的准确性、安全性和完整性, 同时也不承担用户因使用这些下载资源对自己和他人造成任何形式的伤害或损失。
