 CHINACONSTRUCTION:3Q12RESULTSSHOWIMPROVEMENT1214

《CHINACONSTRUCTION:3Q12RESULTSSHOWIMPROVEMENT1214》由会员分享,可在线阅读,更多相关《CHINACONSTRUCTION:3Q12RESULTSSHOWIMPROVEMENT1214(11页珍藏版)》请在装配图网上搜索。
1、9.47.15.6FlashnoteIndustrialsConstruction & EngineeringEquity China31 October 2012Anderson ChowAnalystThe Hongkong and Shanghai BankingCorporation Limited+852 2996 .hkLesley Liu*AssociateView HSBC Global Research at:http:/*Employed by a non-US affiliate ofHSBC Securities (USA) Inc, and is notregiste
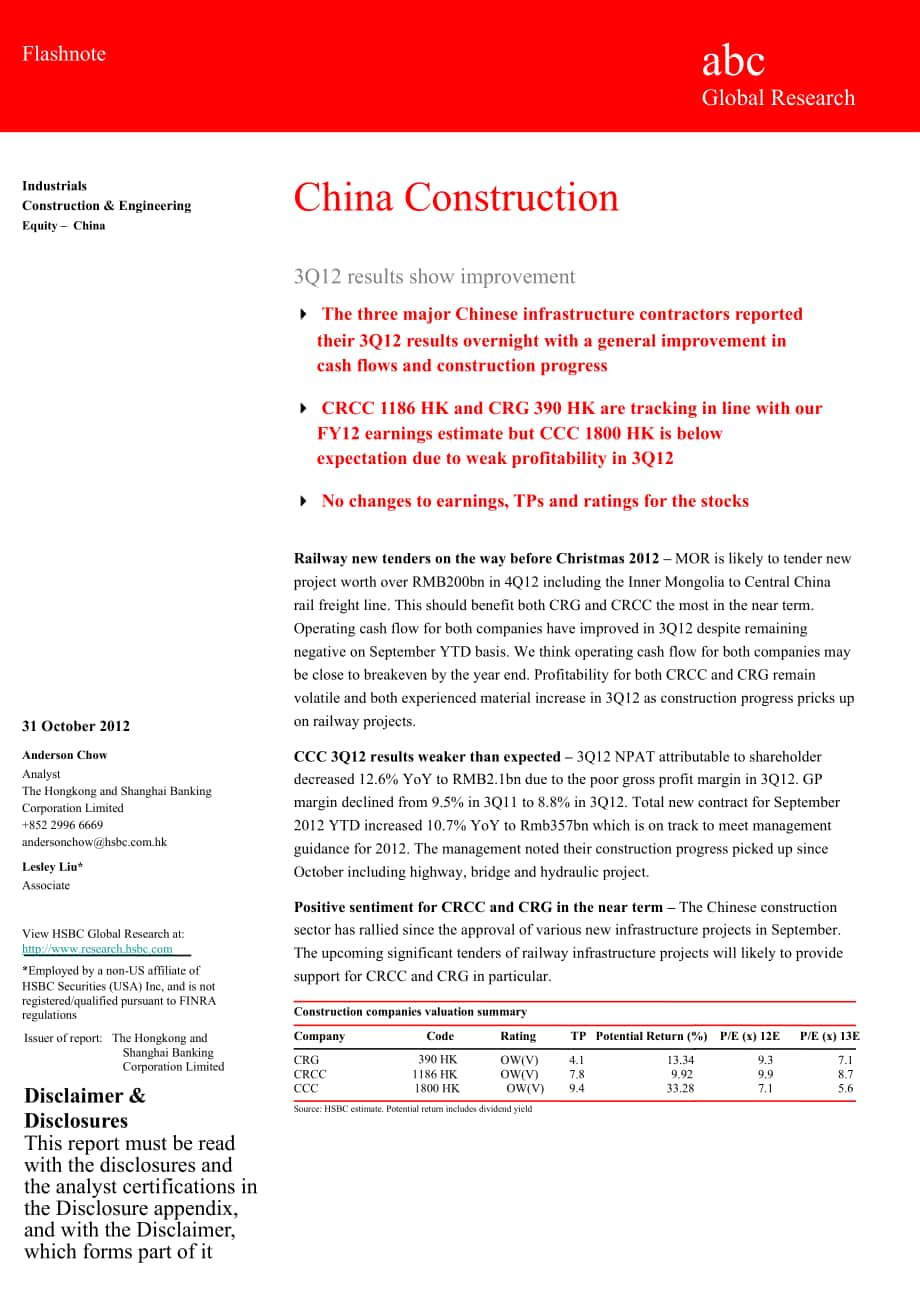
2、red/qualified pursuant to FINRAregulationsabcGlobal ResearchChina Construction3Q12 results show improvement The three major Chinese infrastructure contractors reportedtheir 3Q12 results overnight with a general improvement incash flows and construction progress CRCC 1186 HK and CRG 390 HK are tracki
3、ng in line with ourFY12 earnings estimate but CCC 1800 HK is belowexpectation due to weak profitability in 3Q12 No changes to earnings, TPs and ratings for the stocksRailway new tenders on the way before Christmas 2012 MOR is likely to tender newproject worth over RMB200bn in 4Q12 including the Inne
4、r Mongolia to Central Chinarail freight line. This should benefit both CRG and CRCC the most in the near term.Operating cash flow for both companies have improved in 3Q12 despite remainingnegative on September YTD basis. We think operating cash flow for both companies maybe close to breakeven by the
5、 year end. Profitability for both CRCC and CRG remainvolatile and both experienced material increase in 3Q12 as construction progress pricks upon railway projects.CCC 3Q12 results weaker than expected 3Q12 NPAT attributable to shareholderdecreased 12.6% YoY to RMB2.1bn due to the poor gross profit m
6、argin in 3Q12. GPmargin declined from 9.5% in 3Q11 to 8.8% in 3Q12. Total new contract for September2012 YTD increased 10.7% YoY to Rmb357bn which is on track to meet managementguidance for 2012. The management noted their construction progress picked up sinceOctober including highway, bridge and hy
7、draulic project.Positive sentiment for CRCC and CRG in the near term The Chinese constructionsector has rallied since the approval of various new infrastructure projects in September.The upcoming significant tenders of railway infrastructure projects will likely to providesupport for CRCC and CRG in
8、 particular.Construction companies valuation summaryIssuer of report: The Hongkong andCompanyCodeRatingTP Potential Return (%)P/E (x) 12EP/E (x) 13EShanghai BankingCorporation LimitedCRGCRCC390 HK1186 HKOW(V)OW(V)4.17.813.349.929.39.97.18.7Disclaimer &DisclosuresThis report must be readwith the disc
9、losures andthe analyst certifications inthe Disclosure appendix,and with the Disclaimer,which forms part of itCCC 1800 HK OW(V)Source: HSBC estimate. Potential return includes dividend yield33.28China ConstructionConstruction & Engineering31 October 2012CCC 3Q12 result summaryabcRMB mnRevenueBusines
10、s taxNet revenueCost of salesGross profitGross profit margin (H-share)Other income and gainSelling expensesAdministrative expensesOther expenses, netPROFIT FROM OPERATIONS (EBIT)Operating profit marginFinance costsPROFIT BEFORE TAXTaxNET PROFIT AFTER TAXNet profit margin9M12200,478-5,281195,197-175,
11、37519,82210.2%159-424-8,54428611,2995.8%-2,6948,605-2,0456,5613.4%9M11211,438-6,040205,398-186,35619,0429.3%383-440-7,9701,16812,1825.9%-2,17110,011-1,9778,0343.9%yoy-5.2%-12.6%-5.0%-5.9%4.1%-58.4%-3.5%7.2%-75.5%-7.2%24.1%-14.0%3.4%-18.3%3Q1275,409-1,99673,413-66,9626,4518.8%-22-152-3,131753,2204.4%
12、-7212,499-6691,8302.5%3Q1172,009-2,18169,828-63,2006,6289.5%271-154-2,995743,8245.5%-9922,832-4652,3673.4%yoy4.7%-8.5%5.1%6.0%-2.7%na-0.8%4.6%1.7%-15.8%-27.3%-11.8%43.8%-22.7%Attributable to:Equity holders of the parentMinority interestsEPS (RMB)6,917-3570.448,087-530.55-14.5%na-20.0%2,067-2380.132,
13、36520.16-12.6%na-18.8%Source: CompanyCCC New contract value breakdownRMB bnInfrastructure ConstructionConsists of:Port ConstructionRoad and Bridge ConstructionRailway ConstructionInvestment Business (BOT/BOOSep 12 YTD43.256.50.799.9292.3Sep 11 YTD41.895.10.058.4258.9yoy12.9%3.3%-40.6%na70.9%and BT P
14、rojects, etc.)Overseas ProjectsOther ProjectsInfrastructure DesignDredgingHeavy Machinery ManufacturingOther BusinessesTotal58.034.116.124.720.73.6357.437.625.913.126.020.24.6322.854.2%31.7%22.9%-5.0%2.6%-21.5%10.7%Source: Company2China ConstructionConstruction & Engineering31 October 2012CRG 2012 3
15、Q12 result summaryabcRMB mnRevenueBusiness taxNet revenueCost of salesGross profitGross profit margin (% of net revenue)Other income and gains, netSelling and distribution costsAdministrative expensesProfit/(loss) from operations EBITEBIT marginNet finance cost (including exchange diff)Share of prof
16、its and losses of JCE/AssociateProfit before taxTaxNet profit after taxNet profit margin9M12319,557(9,708)309,850(286,751)23,09910.3%731(1,229)(12,931)9,6703.1%(3,466)-6,204(1,614)4,5901.4%9M11335,852(10,378)325,474(304,922)20,5529.2%150(1,193)(11,937)7,5712.3%(2,328)-5,243(1,404)3,8391.1%yoy-4.9%-6
17、.5%-4.8%-6.0%12.4%388.6%3.0%8.3%27.7%48.9%18.3%14.9%19.6%3Q12121,243(3,743)117,500(108,988)8,51210.1%612(549)(4,657)3,9183.3%(1,296)222,644(594)2,0501.7%3Q11112,917(3,324)109,593(102,360)7,2339.3%135(399)(4,397)2,5722.3%(926)911,737(592)1,1451.0%yoy7.4%12.6%7.2%6.5%17.7%352.3%37.6%5.9%52.3%40.1%-75.
18、6%52.2%0.4%79.0%Attributable to:Equity holders of our CompanyMinority interests4,2733173,56727219.8%16.5%1,8821671,1232267.5%669.6%Source: CompanyCRCC 1186 HK 3Q12 results summaryRMB mnGross RevenueBusiness TaxNet revenueCost of salesGross profitGross profit margin9M12303,177(8,752)294,425(272,118)2
19、2,30710.2%9M11324,270(9,718)314,552(293,060)21,4929.6%yoy-6.5%-9.9%-6.4%-7.1%3.8%3Q12118,645(3,510)115,135(106,825)8,31010.0%3Q11112,864(3,472)109,392(102,307)7,0859.4%yoy5.1%1.1%5.3%4.4%17.3%Other income and gains, netSelling and distribution costsAdministrative expensesProfit/(loss) from operation
20、s EBITEBIT margin371(1,136)(12,692)8,8502.9%109(1,175)(13,187)7,2392.2%241.1%-3.3%-3.8%22.3%124(470)(4,803)3,1622.7%(6)(399)(4,585)2,0951.9%na17.7%4.8%50.9%Net Finance costsShare of profits and losses of Associates and JCEProfit before taxTaxNet profit after taxNet profit margin(2,572)406,318(1,207)
21、5,1111.7%(1,085)46,158(1,177)4,9821.5%137.0%816.9%2.6%2.6%2.6%(863)82,308(420)1,8881.6%(450)11,646(290)1,3561.2%91.6%647.5%40.2%44.5%39.2%Attributable to:Equity holders of the parentMinority interestsEPS (RMB)5,093180.414,990(8)0.402.1%na2.5%1,904(16)0.151,35150.1141.0%na36.4%Source: Company35.35,33
22、6China ConstructionConstruction & Engineering31 October 2012Valuation and risksCCC (1800.HK, OW(V), TP HKD9.4)We use the EV/EBITDA methodology to value the companys construction business, as this is a cyclicalbusiness with volatile cash flow. We believe EV/EBITDA is more appropriate than PE as it co
23、nsiders thebalance sheet strength needed to generate earnings. Our target EV/EBITDA multiple of 5.3x is based on a30% discount to the average trading 7.6x multiple for Asian construction companies. We value thedredging business based on a DCF methodology with a WACC of 11.7% where the risk free rate
24、 is 3%,equity risk premium is 7% and equity beta is 1.24.We value the companys infrastructure investment projects based on estimated book value.Under our research model, for stocks with a volatility indicator, the Neutral band is 10ppts above andbelow the hurdle rate for China stocks of 10%. At the
25、time we set our target price, it implied a potentialreturn that was above the Neutral band of our model; therefore, we rate the stock Overweight (V).Potential return equals the percentage difference between the current share price and the target price,including the forecast dividend yield when indic
26、ated.Downside risks are if new contract growth does not recover in 2H12e and if the 46.1%-owned ZhenhuaHeavy manufacturing business is loss-making again in 2012 due to weak port machinery new orders.Sum of parts valuation HKD9.4 per shareabc(RMB m)FY12eMultipleValuation MethodCommentSegment EVConstr
27、uction business19,508103,781 EV/EBITDA30% discount to average of Asia Pacificconstruction companies trading averageManufacturing - Zhenhua HeavyIndustryDredging36,682 DCF discountrate of 11.7%20% discount to the market value of thesharesInvestment projectsTotal EVFY12E (Net debt) / net cashEquity Va
28、lue (RMB m)Equity Value (HKD m)Per share (HKD)Implied valuationFY12E PEFY12E EV/EBITDAFY12 PBFY13E PEFY13E EV/EBITDAFY13 PB23,902 Book value169,701(47,582)122,119152,405HKD9.409.16.41.77.35.21.2Estimated value as at Dec 2011Net debt of the company ex ZhenhuaSource: HSBC estimatesCRCC (1186.HK, OW(V)
29、, TP HKD7.8)We use a sum-of-the-parts valuation approach.We use EV/EBITDA to value the construction business, as this is a cyclical business with volatile cashflow. EV/EBITDA is more appropriate than PE, as it takes into account the balance sheet strength neededto generate earnings. Our target FY12e
30、 EV/EBITDA multiple of 5.3x is based on a 30% discount to the45.3China ConstructionConstruction & Engineering31 October 2012historical average multiple for Asian construction companies of 7.6x. The discount reflects the higherregulatory and political risks of Chinas infrastructure development sector
31、. We reduce the discount from35% to 30% owing to NDRC policy support of urban subway development, which leads to an increase inour target price.We value the companys manufacturing business based on the average EV/EBITDA multiple of theChinese railway equipment industry, which is 8x.We value the prop
32、erty business on a NAV basis and apply a 30% discount to reflect government policyrisk, which is in line with the discount at which Chinese property companies trade at.Logistics and other business are valued on a PE basis, using the current trading PE of the Hong KongChina Enterprise Index due to th
33、e lack of comparisons for a railway logistics business.These assumptions, and our earnings estimates, lead to a target price at HKD7.8Under our research model, for stocks with a volatility indicator, the Neutral band is 10ppts above andbelow the hurdle rate for China stocks of 10%. At the time we se
34、t our target price, it implied a potentialreturn that was above the Neutral band of our model; therefore, we rate the stock Overweight (V).Potential return equals the percentage difference between the current share price and the target price,including the forecast dividend yield when indicated.Downs
35、ide risks: volatility in profit margin, overseas mining investment and overseas construction project risk.CRCC: sum of parts valuation HKD7.8 per shareabcRMB mnSegment EVConstruction businessFY12E estimate19,115Multiple Valuation Method101,691 EV/EBITDAComment30% discount to Average of Asia Pacificc
36、onstruction companies trading averageManufacturing1,0348.08,272 EV/EBITDAAverage of the Chinese railway equipmentindustry trading averageProperty development7,607 NAV30% of estimated NAVLogistics and other business6198.04,955 PERHSCEI trading multipleTotal EV122,524FY12E Net cash/(Net Debt)Equity Va
37、lue (Rmb m)Equity Value (HKD m)Per share (HKD)Implied valuationFY12E PERFY12E EV/EBITDAFY12 PBVFY13E PERFY13E EV/EBITDAFY13 PBV(45,215)77,30996,4827.810.75.61.19.35.11.0Excluding the difference between advance fromcustomer and prepayment to suppliersSource: HSBC estimates55.34.1China ConstructionCon
38、struction & Engineering31 October 2012CRG (390.HK, OW(V), TP HKD4.1)We use the EV/EBITDA method to value the construction business as this is cyclical with volatile cashflow. We believe EV/EBITDA is more appropriate than PE as it considers the balance sheet strengthneeded to generate earnings.Our ta
39、rget EV/EBITDA multiple of 5.3x is based on a discount of 30% to the 7.6x FY12e averagemultiple of the Asia construction companies. The discount reflects the higher regulatory and politicalrisks in China infrastructure development. We reduce the discount from 35% to 30% owning to NDRCpolicy support
40、of urban subway investment, which leads to an increase in our target price.We value the companys manufacturing business based on an average EV/EBITDA multiple of theChinese railway equipment industry, which is 8x.We value the property business on an NAV basis and apply a 30% discount to it to reflec
41、t governmentpolicy risk, which is in line with the discount at which Chinese property companies trade at. Otherbusiness is valued in line with the current trading PE multiple of the Hang Seng China Enterprise Index.These assumptions, and our earnings estimates, lead to a target price at HKD4.1.Under
42、 our research model, for stocks with a volatility indicator, the Neutral band is 10ppts above andbelow the hurdle rate for China stocks of 10%. At the time we set our target price, it implied a potentialreturn that was above the Neutral band of our model; therefore, we rate the stock Overweight (V).
43、Potential return equals the percentage difference between the current share price and the target price,including the forecast dividend yield when indicated.Downside risks: Business risks in non-railway construction projects, especially overseas and mininginvestment.CRG: sum of parts valuation HKD4.1
44、 per shareabc(Rmb m)Segment EVConstruction businessFY12E estimate17,736MultipleValuation Method94,355 EV/EBITDAComment30% discount to trading average of AsiaPacific construction companiesManufacturingProperty developmentOther business1,2619778.08.010,092 EV/EBITDA17,243 NAV7,817 PERChinese equipment
45、 industry trading average30% discount to estimated NAVHang Seng China Enterprise Index tradingmultipleTotal EV129,507FY12E (Net debt) / net cashEquity Value (Rmb m)Equity Value (HKD m)Equity value per share (HKD)Implied valuationFY12E PERFY12E EV/EBITDAFY12 PBVFY13E PERFY13E EV/EBITDAFY13 PBVSource:
46、 HSBC estimates6(59,276)70,23187,64910.36.50.97.95.81.5Excluding the difference between advancefrom customer and prepayment to suppliersChina ConstructionConstruction & Engineeringabc31 October 2012Disclosure appendixAnalyst CertificationThe following analyst(s), economist(s), and/or strategist(s) w
47、ho is(are) primarily responsible for this report, certifies(y) that theopinion(s) on the subject security(ies) or issuer(s) and/or any other views or forecasts expressed herein accurately reflect theirpersonal view(s) and that no part of their compensation was, is or will be directly or indirectly r
48、elated to the specificrecommendation(s) or views contained in this research report: Anderson ChowImportant disclosuresStock ratings and basis for financial analysisHSBC believes that investors utilise various disciplines and investment horizons when making investment decisions, whichdepend largely o
49、n individual circumstances such as the investors existing holdings, risk tolerance and other considerations.Given these differences, HSBC has two principal aims in its equity research: 1) to identify long-term investment opportunitiesbased on particular themes or ideas that may affect the future ear
50、nings or cash flows of companies on a 12 month time horizon;and 2) from time to time to identify short-term investment opportunities that are derived from fundamental, quantitative,technical or event-driven techniques on a 0-3 month time horizon and which may differ from our long-term investment rat
51、ing.HSBC has assigned ratings for its long-term investment opportunities as described below.This report addresses only the long-term investment opportunities of the companies referred to in the report. As and whenHSBC publishes a short-term trading idea the stocks to which these relate are identifie
52、d on the website Details of these short-term investment opportunities can be found under the Reports section of thiswebsite.HSBC believes an investors decision to buy or sell a stock should depend on individual circumstances such as the investorsexisting holdings and other considerations. Different
53、securities firms use a variety of ratings terms as well as different ratingsystems to describe their recommendations. Investors should carefully read the definitions of the ratings used in each researchreport. In addition, because research reports contain more complete information concerning the ana
54、lysts views, investorsshould carefully read the entire research report and should not infer its contents from the rating. In any case, ratings should notbe used or relied on in isolation as investment advice.Rating definitions for long-term investment opportunitiesStock ratingsHSBC assigns ratings t
55、o its stocks in this sector on the following basis:For each stock we set a required rate of return calculated from the cost of equity for that stocks domestic or, as appropriate,regional market established by our strategy team. The price target for a stock represents the value the analyst expects th
56、e stockto reach over our performance horizon. The performance horizon is 12 months. For a stock to be classified as Overweight, thepotential return, which equals the percentage difference between the current share price and the target price, including theforecast dividend yield when indicated, must
57、exceed the required return by at least 5 percentage points over the next 12 months(or 10 percentage points for a stock classified as Volatile*). For a stock to be classified as Underweight, the stock must beexpected to underperform its required return by at least 5 percentage points over the next 12
58、 months (or 10 percentage pointsfor a stock classified as Volatile*). Stocks between these bands are classified as Neutral.Our ratings are re-calibrated against these bands at the time of any material change (initiation of coverage, change of volatilitystatus or change in price target). Notwithstand
59、ing this, and although ratings are subject to ongoing management review,expected returns will be permitted to move outside the bands as a result of normal share price fluctuations without necessarilytriggering a rating change.7Oct-07Oct-08Oct-09Oct-10Oct-11Oct-1245%16%119531China ConstructionConstru
60、ction & Engineeringabc31 October 2012*A stock will be classified as volatile if its historical volatility has exceeded 40%, if the stock has been listed for less than 12months (unless it is in an industry or sector where volatility is low) or if the analyst expects significant volatility. However,st
61、ocks which we do not consider volatile may in fact also behave in such a way. Historical volatility is defined as the pastmonths average of the daily 365-day moving average volatilities. In order to avoid misleadingly frequent changes in rating,however, volatility has to move 2.5 percentage points p
62、ast the 40% benchmark in either direction for a stocks status to change.Rating distribution for long-term investment opportunitiesAs of 30 October 2012, the distribution of all ratings published is as follows:Overweight (Buy)(28% of these provided with Investment Banking Services)Neutral (Hold)Under
63、weight (Sell)39%(26% of these provided with Investment Banking Services)(19% of these provided with Investment Banking Services)Share price and rating changes for long-term investment opportunitiesChina Railway Group (0390.HK) Share Price performance HKD Vs HSBCRecommendation & price target historyr
64、ating history7Source: HSBCFromNeutral (V)Overweight (V)OverweightNeutralUnderweightUnderweight (V)Neutral (V)Target PricePrice 1Price 2Price 3Price 4Price 5Price 6Price 7Price 8Price 9Price 10Price 11Price 12Price 13ToOverweight (V)OverweightNeutralUnderweightUnderweight (V)Neutral (V)Overweight (V)
65、Value6.606.907.607.006.005.004.501.802.001.802.703.704.10Date26 March 201014 June 201031 October 201028 October 201113 November 201115 August 201206 September 2012Date20 November 200926 March 201013 September 201031 October 201008 December 201011 April 201103 May 201127 September 201128 October 2011
66、30 December 201116 April 201215 August 201206 September 2012Source: HSBC8Oct-07Oct-08Oct-09Oct-10Oct-11Oct-12Oct-07Oct-08Oct-09Oct-10Oct-11Oct-1213119753231883China ConstructionConstruction & Engineering31 October 2012China Railway Constructio (1186.HK) Share Price performance HKD Vs HSBCRecommendation & price target historyabcrating historySource: HSBCFromOverweight (V)Neutral (V)Overweight (V)OverweightNeutralOverweightNeutralUnderweightUnderweight (V)Neutral (V)Target PricePrice 1Price 2Price
- 温馨提示:
1: 本站所有资源如无特殊说明,都需要本地电脑安装OFFICE2007和PDF阅读器。图纸软件为CAD,CAXA,PROE,UG,SolidWorks等.压缩文件请下载最新的WinRAR软件解压。
2: 本站的文档不包含任何第三方提供的附件图纸等,如果需要附件,请联系上传者。文件的所有权益归上传用户所有。
3.本站RAR压缩包中若带图纸,网页内容里面会有图纸预览,若没有图纸预览就没有图纸。
4. 未经权益所有人同意不得将文件中的内容挪作商业或盈利用途。
5. 装配图网仅提供信息存储空间,仅对用户上传内容的表现方式做保护处理,对用户上传分享的文档内容本身不做任何修改或编辑,并不能对任何下载内容负责。
6. 下载文件中如有侵权或不适当内容,请与我们联系,我们立即纠正。
7. 本站不保证下载资源的准确性、安全性和完整性, 同时也不承担用户因使用这些下载资源对自己和他人造成任何形式的伤害或损失。
