 雅思小作文之图表作文

《雅思小作文之图表作文》由会员分享,可在线阅读,更多相关《雅思小作文之图表作文(5页珍藏版)》请在装配图网上搜索。
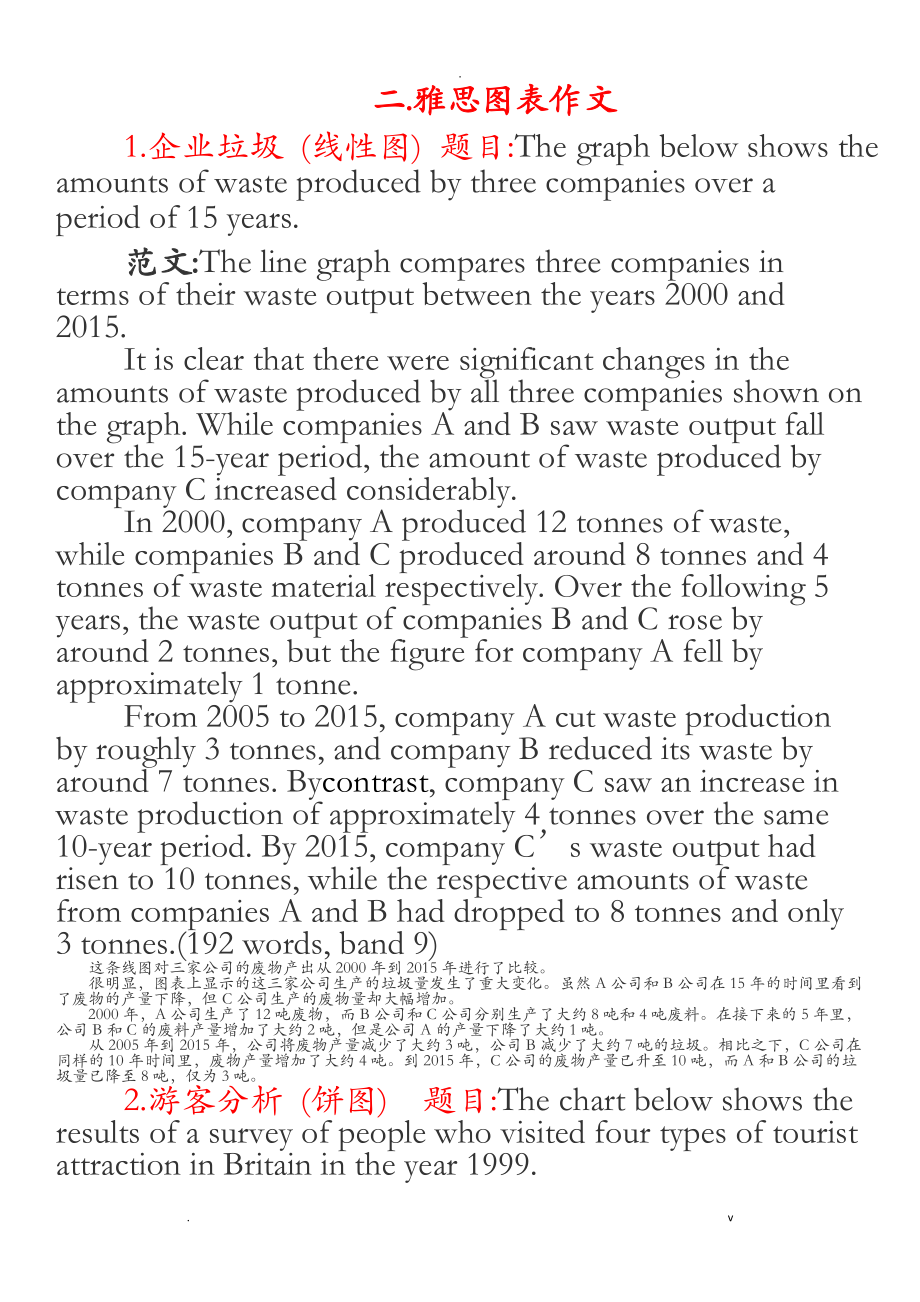
1、.二.雅思图表作文1.企业垃圾 (线性图) 题目:The graph below shows the amounts of waste produced by three companies over a period of 15 years. 范文:The line graph compares three companies in terms of their waste output between the years 2000 and 2015. It is clear that there were significant changes in the amounts of wast
2、e produced by all three companies shown on the graph. While companies A and B saw waste output fall over the 15-year period, the amount of waste produced by company C increased considerably. In 2000, company A produced 12 tonnes of waste, while companies B and C produced around 8 tonnes and 4 tonnes
3、 of waste material respectively. Over the following 5 years, the waste output of companies B and C rose by around 2 tonnes, but the figure for company A fell by approximately 1 tonne. From 2005 to 2015, company A cut waste production by roughly 3 tonnes, and company B reduced its waste by around 7 t
4、onnes. Bycontrast, company C saw an increase in waste production of approximately 4 tonnes over the same 10-year period. By 2015, company Cs waste output had risen to 10 tonnes, while the respective amounts of waste from companies A and B had dropped to 8 tonnes and only 3 tonnes.(192 words, band 9)
5、 这条线图对三家公司的废物产出从2000年到2015年进行了比较。很明显,图表上显示的这三家公司生产的垃圾量发生了重大变化。虽然A公司和B公司在15年的时间里看到了废物的产量下降,但C公司生产的废物量却大幅增加。2000年,A公司生产了12吨废物,而B公司和C公司分别生产了大约8吨和4吨废料。在接下来的5年里,公司B和C的废料产量增加了大约2吨,但是公司A的产量下降了大约1吨。从2005年到2015年,公司将废物产量减少了大约3吨,公司B减少了大约7吨的垃圾。相比之下,C公司在同样的10年时间里,废物产量增加了大约4吨。到2015年,C公司的废物产量已升至10吨,而A和B公司的垃圾量已降至8吨
6、,仅为3吨。2.游客分析 (饼图) 题目:The chart below shows the results of a survey of people who visited four types of tourist attraction in Britain in the year 1999. 范文:The pie chart compares figures for visitors to four categories of tourist attraction and to five different theme parks in Britain in 1999. It is c
7、lear that theme parks and museums / galleries were the two most popular types of tourist attraction in that year. Blackpool Pleasure Beach received by far the highest proportion of visitors in the theme park sector. Looking at the informationin more detail, we can see that 38% of the surveyed visito
8、rs went to a theme park, and 37% of them went to a museum or gallery. By contrast, historic houses and monuments were visited by only 16% of the sample, while wildlife parks and zoos were the least popular of the four types of tourist attraction, with only 9% of visitors. In the theme park sector, a
9、lmost half of the people surveyed (47%) had been to Blackpool Pleasure Beach. Alton Towers was the second most popular amusement park, with 17% of the sample, followed by Pleasureland in Southport, with 16%. Finally, Chessington World of Adventures and Legoland Windsor had each welcomed 10% of the s
10、urveyed visitors.(181 words, band 9) 这个饼状图比较了1999年英国的四类旅游景点和5个不同主题公园的游客人数。很明显,主题公园和博物馆/画廊是那一年最受欢迎的两种旅游景点。在主题公园中,黑潭快乐海滩获得的游客比例是最高的。更详细地看这些信息,我们可以看到,38%的受访游客去了一个主题公园,其中37%的人去了博物馆或美术馆。相比之下,只有16%的样本参观了历史建筑和纪念碑,而野生动物公园和动物园则是这四种旅游景点中最不受欢迎的,只有9%的游客。在主题公园领域,几乎一半的被调查者(47%)曾经到过布莱克浦的快乐海滩。奥尔顿塔是第二大最受欢迎的游乐园,有17%的
11、样本,其次是在索斯波特的娱乐公园,占16%。最后,查辛顿冒险世界和乐高和温莎的游客都欢迎10%的游客。3.各地房价(饼图) 题目:The chart below shows information about changes in average house prices in five different cities between 1990 and 2002 compared with the average house prices in 1989. 范文:he bar chart compares the cost of an average house in five major
12、cities over a period of 13 years from 1989. We can see that house prices fell overall between 1990 and 1995, but most of the cities saw rising prices between 1996 and 2002. London experienced by far the greatest changes in house prices over the 13-year period. Over the 5 years after 1989, the cost o
13、f average homes in Tokyo and London dropped by around 7%, while New York house prices went down by 5%. By contrast, prices rose by approximately 2% in both Madrid and Frankfurt. Between 1996 and 2002, London house prices jumped to around 12% above the 1989 average. Homebuyers in New York also had to
14、 pay significantly more, with prices rising to 5% above the 1989 average, but homes in Tokyo remained cheaper than they were in 1989. The cost of an average home in Madrid rose by a further 2%, while prices in Frankfurt remained stable.(165 words) 柱状图比较了从1989年开始的13年里,五个主要城市的平均房价。我们可以看到,在1990年至1995年期
15、间,房价总体下跌,但大多数城市在1996年至2002年期间房价上涨。在过去的13年里,伦敦经历了房价的最大变化。柱状图比较了从1989年开始的13年里,五个主要城市的平均房价。在1989年之后的5年里,东京和伦敦的平均房价下跌了7%,而纽约房价下跌了5个百分点。相比之下,马德里和法兰克福的房价都上涨了大约2个百分点。从1996年到2002年,伦敦房价跳涨到比1989年平均水平高出12个百分点。纽约的购房者也不得不支付更高的价格,房价比1989年的平均水平高出5%,但东京的房价仍然低于1989年的水平。在马德里,平均房价上涨了2%,而法兰克福的房价则保持稳定。4.骑车上班(表格) 题目:The
16、table below shows changes in the numbers of residents cycling to work in different areas of the UK between 2001 and 2011. 范文:The table compares the numbers of people who cycled to work in twelve areas of the UK in the years 2001 and 2011. Overall, the number of UK commuters who travelled to work by
17、bicycle rose considerably over the 10-year period. Inner London had by far the highest number of cycling commuters in both years. In 2001, well over 43 thousand residents of inner London commuted by bicycle, and this figure rose to more than 106 thousand in 2011, an increase of 144%. By contrast, al
18、though outer London had the second highest number of cycling commuters in each year, the percentage change, at only 45%, was the lowest of the twelve areas shown in the table. Brighton and Hove saw the second biggest increase (109%) in the number of residents cycling to work, but Bristol was the UKs
19、 second city in terms of total numbers of cycling commuters, with 8,108 in 2001 and 15,768 in 2011. Figures for the other eight areas were below the 10 thousand mark in both years.(172 words, band 9) 这张表格比较了2001年和2011年在英国12个地区骑车上班的人的数量。总的来说,在过去的10年里,骑自行车上班的英国上班族的数量大幅增加。在这两年中,伦敦市中心的自行车上班族数量是最多的。2001年
20、,伦敦市中心有超过43万居民骑自行车上下班,2011年这个数字上升到超过106万,增长了144%。相比之下,尽管伦敦的自行车上班族每年的出行次数是第二高的,但这个百分比的变化,只有45%,是表中所显示的12个区域中最低的。布莱顿和霍夫在骑车上班的人数中排名第二(109%),但在自行车上班族的总数中,布里斯托尔是英国的第二大城市,2001年为8108人,2011年为15768人。其他8个地区的数据在这两年内都低于1万。5.水消耗(混合图)题目:The graph and table below give information about water use worldwide and wate
21、r consumption in two different countries. 范文:The charts compare the amount of water used for agriculture, industry and homes around the world, and water use in Brazil and the Democratic Republic of Congo. It is clear that global water needs rose significantly between 1900 and 2000, and that agricult
22、ure accounted for the largest proportion of water used. We can also see that water consumption was considerably higher in Brazil than in the Congo. In 1900, around 500km of water was used by the agriculture sector worldwide. The figures for industrial and domestic water consumption stood at around o
23、ne fifth of that amount. By 2000, global water use for agriculture had increased to around 3000km, industrial water use had risen to just under half that amount, and domestic consumption had reached approximately 500km. In the year 2000, the populations of Brazil and the Congo were 176 million and 5
24、.2 million respectively. Water consumption per person in Brazil, at 359m, was much higher than that in the Congo, at only 8m, and this could be explained by the fact that Brazil had 265 times more irrigated land.(184 words, band 9) 这些图表比较了世界各地的农业、工业和家庭用水的数量,以及巴西和刚果民主共和国的用水情况。显然,在1900年至2000年期间,全球的水需求
25、显著增加,农业用水占用水的比例最大。我们还可以看到,巴西的用水量比刚果要高得多。1900年,全世界的农业部门使用了大约500公里的水。工业和家庭用水的数字大约是这一数字的五分之一。到2000年,全球用于农业的用水量增加到约3000公里,工业用水已增加到不足一半,国内消费已达到约500公里。在2000年,巴西和刚果的人口分别为1.76亿和520万。巴西人均用水量为3.59亿,比刚果的人均用水量要高得多,仅为800万,这可以解释为巴西的灌溉面积是265倍。6.教育水平(饼图)题目:The charts below give information about levels of education
26、 in Glasgow, a city in Scotland, in 2010.The bar chart and pie charts illustrate the percentage of people in Glasgow having three levels of education (university, school and those with no qualifications) in 2010. Information is divided into five age groups in the bar chart and by gender in the pie c
27、harts.Overall, the majority of people with university education were in the younger age groups, while in the oldest age group most people did not have any qualifications. The proportions of men and women were similar and showed little difference between the levels of education.The percentage of peop
28、le with university education was up to 76% in the younger three age groups compared to only 50% in those aged 50 to 75 and just 25% in those over 75. This trend was reversed in those with no qualifications (9% in younger people rising to 75% in the oldest age group). The figure for those with school education was relatively constant at around 20% but was as low as 3% in the over 75s.The proportion of men and women in each level of education was around one third with only a slight difference of 3% in university graduates as well as those who did not have educational qualifications.(202). v
- 温馨提示:
1: 本站所有资源如无特殊说明,都需要本地电脑安装OFFICE2007和PDF阅读器。图纸软件为CAD,CAXA,PROE,UG,SolidWorks等.压缩文件请下载最新的WinRAR软件解压。
2: 本站的文档不包含任何第三方提供的附件图纸等,如果需要附件,请联系上传者。文件的所有权益归上传用户所有。
3.本站RAR压缩包中若带图纸,网页内容里面会有图纸预览,若没有图纸预览就没有图纸。
4. 未经权益所有人同意不得将文件中的内容挪作商业或盈利用途。
5. 装配图网仅提供信息存储空间,仅对用户上传内容的表现方式做保护处理,对用户上传分享的文档内容本身不做任何修改或编辑,并不能对任何下载内容负责。
6. 下载文件中如有侵权或不适当内容,请与我们联系,我们立即纠正。
7. 本站不保证下载资源的准确性、安全性和完整性, 同时也不承担用户因使用这些下载资源对自己和他人造成任何形式的伤害或损失。
