 BANKINGSECTOR:SLOWINGEARNINGSMOMENTUMIN3Q12F1011

《BANKINGSECTOR:SLOWINGEARNINGSMOMENTUMIN3Q12F1011》由会员分享,可在线阅读,更多相关《BANKINGSECTOR:SLOWINGEARNINGSMOMENTUMIN3Q12F1011(12页珍藏版)》请在装配图网上搜索。
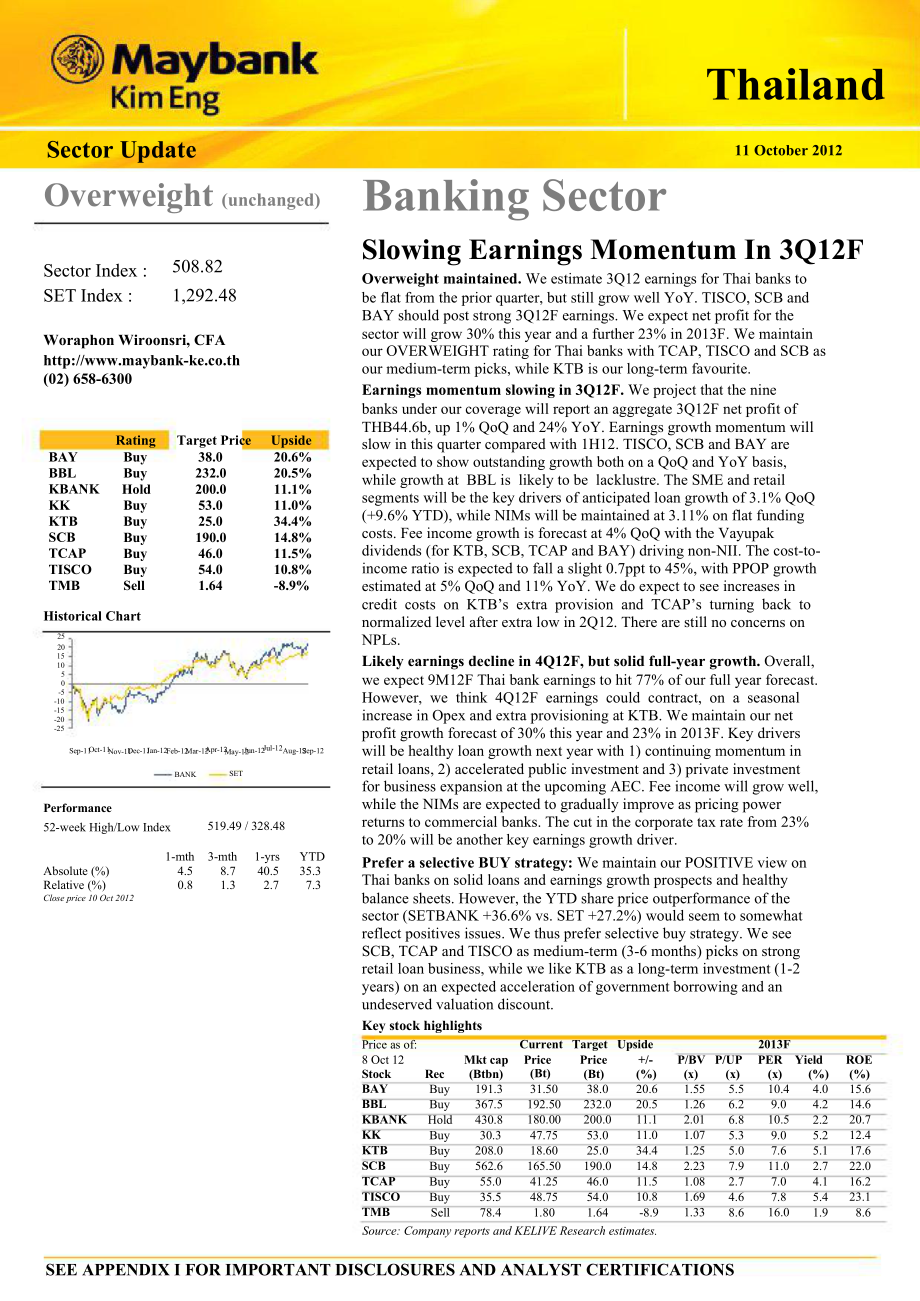
1、Sep-11Nov-11 Dec-11Apr-12Oct-11Aug-12May-12Sep-12Jan-12Jun-12Feb-12 Mar-12Jul-12151050-10-5-15-20-25ThailandSector UpdateOverweight (unchanged)Banking Sector11 October 2012Sector Index :SET Index :508.821,292.48Slowing Earnings Momentum In 3Q12FOverweight maintained. We estimate 3Q12 earnings for Th
2、ai banks tobe flat from the prior quarter, but still grow well YoY. TISCO, SCB andBAY should post strong 3Q12F earnings. We expect net profit for theWoraphon Wiroonsri, CFAhttp:/www.maybank-ke.co.th(02) 658-6300sector will grow 30% this year and a further 23% in 2013F. We maintainour OVERWEIGHT rati
3、ng for Thai banks with TCAP, TISCO and SCB asour medium-term picks, while KTB is our long-term favourite.Earnings momentum slowing in 3Q12F. We project that the ninebanks under our coverage will report an aggregate 3Q12F net profit ofBAYBBLKBANKKKKTBSCBTCAPTISCOTMBRatingBuyBuyHoldBuyBuyBuyBuyBuySell
4、Target Price38.0232.0200.053.025.0190.046.054.01.64Upside20.6%20.5%11.1%11.0%34.4%14.8%11.5%10.8%-8.9%THB44.6b, up 1% QoQ and 24% YoY. Earnings growth momentum willslow in this quarter compared with 1H12. TISCO, SCB and BAY areexpected to show outstanding growth both on a QoQ and YoY basis,while gro
5、wth at BBL is likely to be lacklustre. The SME and retailsegments will be the key drivers of anticipated loan growth of 3.1% QoQ(+9.6% YTD), while NIMs will be maintained at 3.11% on flat fundingcosts. Fee income growth is forecast at 4% QoQ with the Vayupakdividends (for KTB, SCB, TCAP and BAY) dri
6、ving non-NII. The cost-to-income ratio is expected to fall a slight 0.7ppt to 45%, with PPOP growthestimated at 5% QoQ and 11% YoY. We do expect to see increases inHistorical Chart2520credit costs on KTBs extra provision and TCAPs turning back tonormalized level after extra low in 2Q12. There are st
7、ill no concerns onNPLs.Likely earnings decline in 4Q12F, but solid full-year growth. Overall,we expect 9M12F Thai bank earnings to hit 77% of our full year forecast.However, we think 4Q12F earnings could contract, on a seasonalincrease in Opex and extra provisioning at KTB. We maintain our netprofit
8、 growth forecast of 30% this year and 23% in 2013F. Key driverswill be healthy loan growth next year with 1) continuing momentum inPerformance52-week High/Low IndexBANKSET519.49 / 328.48retail loans, 2) accelerated public investment and 3) private investmentfor business expansion at the upcoming AEC
9、. Fee income will grow well,while the NIMs are expected to gradually improve as pricing powerreturns to commercial banks. The cut in the corporate tax rate from 23%to 20% will be another key earnings growth driver.Absolute (%)Relative (%)1-mth4.50.83-mth8.71.31-yrs40.52.7YTD35.37.3Prefer a selective
10、 BUY strategy: We maintain our POSITIVE view onThai banks on solid loans and earnings growth prospects and healthyClose price 10 Oct 2012balance sheets. However, the YTD share price outperformance of thesector (SETBANK +36.6% vs. SET +27.2%) would seem to somewhatreflect positives issues. We thus pr
11、efer selective buy strategy. We seeSCB, TCAP and TISCO as medium-term (3-6 months) picks on strongretail loan business, while we like KTB as a long-term investment (1-2years) on an expected acceleration of government borrowing and anundeserved valuation discount.Key stock highlightsPrice as of:Curre
12、nt Target Upside2013F8 Oct 12Mkt cap PricePrice+/-P/BV P/UP PER YieldROEStockBAYBBLKBANKKKKTBSCBTCAPTISCOTMBRecBuyBuyHoldBuyBuyBuyBuyBuySell(Btbn)191.3367.5430.830.3208.0562.655.035.578.4(Bt)31.50192.50180.0047.7518.60165.5041.2548.751.80(Bt)38.0232.0200.053.025.0190.046.054.01.64(%)20.620.511.111.0
13、34.414.811.510.8-8.9(x)1.551.262.011.071.252.231.081.691.33(x)5.56.26.85.35.07.92.74.68.6(x)10.49.010.59.07.611.07.07.816.0(%)4.04.22.25.25.12.74.15.41.9(%)15.614.620.712.417.622.016.223.18.6Source: Company reports and KELIVE Research estimates.SEE APPENDIX I FOR IMPORTANT DISCLOSURES AND ANALYST CE
14、RTIFICATIONSBANKING SECTORTable 1: Thai banks Comparative Valuations8-Oct-12Current Price (Bt)Market cap (Btmn)No. of shares - end 2011 (mn)RecommendationTarget Price% upside to targetBAY31.50191,3366,074Buy38.021%BBL192.50367,4521,909Buy232.021%KBANK180.00430,7872,393Hold200.011%KK47.7530,289634Buy
15、53.011%KTB18.60208,04611,185Buy25.034%SCB165.50562,5663,399Buy190.015%TCAP41.2554,9931,333Buy46.012%TISCO48.7535,486728Buy54.011%TMB1.8078,35243,529Sell1.64-9%SectorPrice/BV (X)201020112012F2013F1.931.871.711.551.591.511.391.263.192.782.362.011.311.271.151.071.651.601.421.253.653.032.622.231.521.441
16、.221.082.402.191.941.691.571.501.411.332.242.051.801.59Price/Underlying profits (X)201020112012F2013F7.746.886.425.458.377.967.206.2111.609.077.716.805.736.435.865.297.835.725.014.9914.6111.499.317.933.143.773.262.725.815.785.404.6416.0610.9210.218.639.538.117.046.15PER - fully diluted (X)2010201120
17、12F2013F21.7620.6513.1410.3914.9413.4410.969.0221.4917.7812.3610.519.6210.6210.258.9713.9512.228.687.5523.2415.5113.4610.969.3510.548.467.0412.2810.869.447.8224.4719.5416.6516.0118.0915.0011.629.62Dividend yield (%)201020112012F2013F1.812.223.173.972.603.123.644.161.391.391.942.225.035.034.195.242.7
18、43.333.765.111.812.112.422.722.912.913.394.124.624.825.135.440.831.671.941.942.072.402.913.45ROE (%)201020112012F2013F9.29.213.615.611.611.513.214.615.716.720.720.714.712.810.912.412.513.316.317.616.421.320.822.016.213.515.316.221.221.121.823.16.67.98.78.613.114.316.317.5Net profit (Btmn)20102011201
19、2F2013F8,7939,26414,56018,41024,59327,33833,52840,73520,04724,22634,84241,0012,8402,8593,1854,42114,91317,02725,47334,44324,20636,27341,78051,3495,6395,0026,2317,4892,8883,2673,7584,5373,2024,0094,7064,893107,122129,265168,064207,278EPS growth - fully diluted (% yoy)201020112012F2013F325572620112321
20、3621441817-9414221441151750152311-11252052131521652517424.420.629.120.8EPS - fully diluted (Bt)201020112012F2013FBook value (Bt) 2010Book value (Bt) 2011Book value (Bt) 2012FBook value (Bt) 2013FDPS (Bt) 2010DPS (Bt) 2011DPS (Bt) 2012FDPS (Bt) 2013FAssumptions behind target pricesSustainable ROELT g
21、rowthCost of equityImplied P/BV multiple1.451.532.403.0316.2816.8718.4220.330.570.701.001.25BAY17.5%5.5%11.9%1.8712.8814.3217.5621.34120.79127.73138.79152.635.006.007.008.00BBL16.0%5.0%12.2%1.528.3810.1214.5617.1356.3864.6876.2489.622.502.503.504.00KBANK21.0%5.0%12.2%2.234.974.504.665.3236.5337.6541
22、.6144.692.402.402.002.50KK14.0%5.0%12.6%1.181.331.522.142.4611.2511.6113.1314.890.510.620.700.95KTB17.5%5.0%12.5%1.677.1210.6712.2915.1145.4054.6863.2374.093.003.504.004.50SCB22.5%5.5%12.1%2.564.413.914.885.8627.0728.7033.8538.311.201.201.401.70TCAP15.5%5.0%12.4%1.203.974.495.166.2320.3022.2725.0828
23、.882.252.352.502.65TISCO19.0%5.0%12.5%1.870.070.090.110.111.141.201.271.350.020.030.040.04TMB14.5%5.0%12.9%1.21Source: SET, Company reports and KELIVE Research estimates. *Implied target P/BV multiple derived from (ROE g)/(CoE g)11 October 2012Page 2 of 12BANKING SECTOREarnings momentum in 3Q12F to
24、slowWe project that the nine banks we cover will report an aggregate3Q12F net profit of THB44.6b, up 1% QoQ and 24% YoY. Earningsgrowth momentum this quarter will slow from 1H12. We expect BAY,KTB, SCB and TISCO to report net profit at new quarterly highs.Table 2: Thai banks 3Q12F earnings previewBt
25、mnNet interest incomeNon interest incomeNon interest expensePre-provision profitBAY10,3935,3267,8277,892BBL KBANK13,919 16,0068,028 10,6689,354 11,62812,593 15,047KK1,8348951,3721,357KTB14,7566,3828,89112,246SCB15,92710,61810,43716,108TCAP6,4073,4805,6754,213TISCO1,8451,3761,4601,762TMB4,1371,7063,6
26、352,207Sector85,22548,47960,27873,426%qoq3.0%3.9%1.7%4.7%yoy8.7%11.7%8.6%10.7%Provision expense2,7801,6601,9622732,5142,18076545194413,5293.9%0.5%Pre-tax profit5,11310,933 13,0851,0839,73213,9283,4481,3101,26459,8974.9%13.3%Net profit3,9208,2899,4708307,59110,6301,6051,0021,24544,5831.1%23.8%EPS (B)
27、0.654.343.961.230.683.131.261.380.03Norm profit3,9208,2899,4708307,59110,6301,6051,0021,24544,5831.1%23.8%Norm EPS (B)0.654.343.961.230.683.131.261.380.03AssetsEquitiesLoansDeposits1,038,7692,299,5561,956,929 243,2492,165,6262,065,559 962,615 245,733 675,62511,653,659111,717 262,373 179,500 34,200 1
28、45,235 209,302 42,032 17,148 54,438 1,055,945741,2021,475,4491,245,863 156,2221,501,0201,453,430 679,660 225,641 397,423 7,875,910659,7351,756,5141,378,655 149,2591,633,2491,509,809 655,830 158,784 490,176 8,392,0112.6%5.3%3.1%6.8%2Q12A12.6%15.6%13.9%24.8%3Q11AL/D ratioNIMAsset yieldsFunding costSpr
29、eadCost-to-income ratioNPLsCoverage ratioProvision/BoT requiredROE112%4.37%6.39%2.38%4.01%50%2.0%133%164%14.3%84%2.51%4.22%1.75%2.47%43%2.6%192%232%12.8%90%3.56%5.08%1.75%3.33%44%2.0%157%154%21.7%105%3.25%6.47%3.33%3.14%50%3.4%109%142%11.3%92%2.86%4.78%2.04%2.74%42%3.4%73%109%21.5%96%3.28%5.11%2.00%
30、3.11%39%1.9%155%154%20.8%104%2.83%5.44%2.73%2.71%57%5.0%72%125%15.6%142%3.12%6.46%3.36%3.10%45%1.2%181%190%24.1%81%2.61%4.42%1.97%2.45%62%5.2%85%142%9.3%94%3.11%5.03%2.06%2.96%45%3.1%120%156%17.3%97%3.09%4.98%2.04%2.94%46%3.3%117%153%17.7%103%3.25%4.99%1.91%3.08%46%3.9%102%141%15.9%Source: Company r
31、eports and KELIVE Research estimates.TISCO, SCB and BAY should show outstanding growth both QoQ andYoY, while BBLs earnings are likely to be lacklustre. Other banks areexpected to report flat QoQ earnings.Table 3: Thai banks 3Q12F Net profit forecastBtmnBAYBBLKBANKKKKTBSCBTCAPTISCOTMBSector3Q113,007
32、7,5517,7618745,4928,3511,33789975036,0222Q123,6998,8749,3678187,38410,0741,7099201,26344,1073Q12F3,9208,2899,4708307,59110,6301,6051,0021,24544,583%qoq6%-7%1%2%3%6%-6%9%-1%1%yoy30%10%22%-5%38%27%20%11%66%24%Source: Company reports and KELIVE Research estimates.Table 4: Thai banks PPOPBtmnBAYBBLKBANK
33、KKKTBSCBTCAPTISCOTMBSector3Q116,87512,80413,2941,47710,41814,1333,2391,5762,51366,3282Q127,84512,21414,4501,52311,09615,0074,0231,7762,21170,1473Q12F7,89212,59315,0471,35712,24616,1084,2131,7622,20773,426%qoq1%3%4%-11%10%7%5%-1%0%5%yoy15%-2%13%-8%18%14%30%12%-12%11%Source: Company reports and KELIVE
34、 Research estimates.11 October 2012Page 3 of 12TISCOTISCOTCAPTMBTCAPKBANKKBANKSectorSectorBAYBAYTMBSCBKTBSCBKTBKKBBLKKBBLBANKING SECTORTable 5: Thai banks Net Interest IncomeBtmnBAYBBLKBANKKKKTBSCBTCAPTISCOTMBSector3Q119,73313,85314,6801,67613,33813,5336,1361,7413,74778,4382Q1210,05213,93315,4651,92
35、114,28915,1726,1641,7294,05182,7753Q12F10,39313,91916,0061,83414,75615,9276,4071,8454,13785,225%qoq3%0%3%-5%3%5%4%7%2%3%yoy7%0%9%9%11%18%4%6%10%9%Source: Company reports and KELIVE Research estimates.The SME and retail segments will likely be the main drivers for loangrowth of 3.1% QoQ (+9.6% YTD).
36、Auto hire purchase remains thefastest-growing segment from strong domestic car sales. We expectTISCO, SCB, TCAP and KK to reported outstanding loan expansion in3Q12F, in line with our full-year loan growth projections.Table 6: Thai banks Net loan growthBtbnBAYBBLKBANKKKKTBSCBTCAPTISCOTMBSector3Q1166
37、71,3261,1621261,2831,1986111773666,9172Q127291,4611,2151491,4611,3696502054007,6413Q12F7411,4751,2461561,5011,4536802263977,876%qoq1.7%1.0%2.5%4.6%2.7%6.1%4.5%9.8%-0.7%3.1%yoy11.2%11.2%7.2%23.8%17.0%21.3%11.3%27.3%8.5%13.9%Source: Company reports and KELIVE Research estimates.Chart 1: Thai Banks 3Q1
38、2F qoq net loans growth12.0%Chart 2: Thai Banks 9M12F net loans growth30.0%10.0%8.0%9.8%6.1%25.0%20.0%24.8%18.9%6.0%4.6%4.5%15.0%16.3%4.0%2.0%3.1%2.7%2.5%1.7%1.0%10.0%11.3%9.6%8.4%7.4%6.2%6.2%5.5%0.0%5.0%-2.0%Source: Company reports and KELIVE Research estimates.-0.7%0.0%Source: Company reports and
39、KELIVE Research estimates.NIM remains at 3.11% on flat funding costs.Table 7: Thai banks Net Interest Margin3Q112Q123Q12Fqoq (bps)yoy (bps)BAYBBLKBANKKKKTBSCBTCAPTISCOTMBSector4.52%2.82%3.65%3.89%3.02%3.32%2.94%3.47%2.46%3.25%4.33%2.57%3.53%3.70%2.82%3.21%2.81%3.01%2.52%3.09%4.37%2.51%3.56%3.25%2.86
40、%3.28%2.83%3.12%2.61%3.11%5-63-464721182-15-31-8-65-16-4-10-3515-14Source: Company reports and KELIVE Research estimates.11 October 2012Page 4 of 121Q052Q053Q054Q051Q062Q063Q064Q061Q072Q073Q074Q071Q082Q083Q084Q081Q092Q093Q094Q091Q102Q103Q104Q101Q112Q113Q114Q111Q122Q123Q12FTISCOKBANKTCAPTMBSCBKTBKKSe
41、ctorBAYBBLBANKING SECTORChart 3: Thai Banks Net Interest MarginChart 4: Thai Banks 3Q12F Net Interest Margin7.0%4.5%4.37%6.0%5.03%4.0%5.0%3.56%4.0%3.11%3.5%3.28% 3.25%3.0%3.0%3.12% 3.11%2.86% 2.83%2.0%1.0%2.06%2.5%2.61%2.51%0.0%2.0%NIMAsset yieldFunding costSource: Company reports and KELIVE Researc
42、h estimates.Source: Company reports and KELIVE Research estimates.Fee income growth is forecasted at 4% QoQ driven by retail bankingbusiness i.e. bancassurance, mutual funds and credit cards. Vayupakdividend (for KTB, SCB, TCAP and BAY) will drive non-NII growth.Table 8: Thai banks Net fee incomeBtm
43、nBAYBBLKBANKKKKTBSCBTCAPTISCOTMBSector3Q112,7504,4685,4983892,9285,40983272894423,9472Q123,2604,7015,9654503,1545,0571,0229241,10725,6403Q12F3,3264,7716,1534853,2595,3991,0809701,09726,540%qoq2%1%3%8%3%7%6%5%-1%4%yoy21%7%12%25%11%0%30%33%16%11%Source: Company reports and KELIVE Research estimates.Th
44、e cost-to-income ratio should fall slightly, by 0.7ppt qoq, to 45%.Table 9: Thai banks Cost to income ratio3Q112Q123Q12FqoqyoyBAYBBLKBANKKKKTBSCBTCAPTISCOTMBSector52.3%40.0%43.6%41.8%44.6%39.8%64.7%44.4%55.6%45.6%49.4%44.6%44.2%44.3%43.9%40.1%57.9%44.4%61.1%45.8%49.8%42.6%43.6%50.3%42.1%39.3%57.4%45
45、.3%62.2%45.1%0.4%-2.0%-0.6%6.0%-1.8%-0.8%-0.5%0.9%1.1%-0.7%-2.5%2.6%0.0%8.5%-2.6%-0.5%-7.3%0.9%6.6%-0.5%Source: Company reports and KELIVE Research estimates.Credit costs is likely to rise from KTBs extra provision and TCAPsturning back to normal level after extra low in 2Q12. There is still noconce
46、rn on NPLs.Table 10: Thai banks Provisioning expensesBtmnBAYBBLKBANKKKKTBSCBTCAPTISCOTMBSector3Q112,6241,6851,7193723,0121,8721293021,74713,4632Q122,9901,6641,8945601,5432,36548859193213,0263Q12F2,7801,6601,9622732,5142,18076545194413,529%qoq-7%0%4%-51%63%-8%57%-24%1%4%yoy6%-1%14%-27%-17%16%493%50%-
47、46%0%Source: Company reports and KELIVE Research estimates.11 October 2012Page 5 of 12TISCO2012F2013F2014FTCAP2002 2003 2004 2005 2006 2007 2008 2009 2010 20112012F2013F2014F2002 2003 2004 2005 2006 2007 2008 2009 2010 20112012F 2013FKBANKSectorBAY2014F20042005200620072008200920102011TMBSCBKTBKKBBL3
48、.08%BANKING SECTORLikely earnings decline in 4Q12F, but solid full-year growthOverall, we expect 9M12F Thai bank earnings to reach 77% of our fullyear forecast, even though we think earnings will contract in 4Q12F onseasonally rising Opex and extra provisioning at KTB. We maintain ournet profit grow
49、th forecast of 30% this year and 23% in 2013F. The keysupports will be healthy loan growth next year, on 1) continuingmomentum in the retail loan sector, 2) accelerated public investmentand 3) private investment in the upcoming AEC. Fee income willexpand, while NIMs are expected to gradually improve
50、 as pricingpower returns to commercial banks. The reduction in corporate taxrates to 20% from 23% will be another support to earnings.Chart 5: Thai Banks Loans growthChart 6: Thai Banks 2013F Loans growth20.0%18.0%17.7%25.0%23.6%16.0%14.0%12.0%10.0%8.0% 6.6%6.0%9.6%13.9%5.7%8.3%6.3%12.2%15.1%14.6%10
51、.9%10.5%20.0%15.0%10.0%16.4%14.1%12.5%10.9%9.5%9.5%9.4%8.6%8.5%4.0%2.0%0.0%1.1%5.0%0.0%Source: Company reports and KELIVE Research estimates.Chart 7: Thai Banks Net Interest MarginSource: Company reports and KELIVE Research estimates.Chart 8: Thai Banks Fee income growth3.50%3.30%3.10%2.90%2.70%2.50
52、%2.89%2.46%3.36%3.02%3.30%3.12%3.16% 3.18%3.13%3.22%25.0%20.0%15.0%12.7%23.4%13.9%15.4%13.2% 13.7%21.9%16.9%15.7%12.1%2.30%2.10%1.87%10.0%7.8%1.90% 1.72%1.70%1.50%Source: Company reports and KELIVE Research estimates.5.0%0.0%Source: Company reports and KELIVE Research estimates.We expect BAY, KTB an
53、d KBANK to report outstanding net profitgrowth this year while KK, KTB and BAY will be the best performers inthe banking sector in term of earnings growth in 2013F.11 October 2012Page 6 of 12TISCOTISCOTCAPTMBKBANKSectorTCAP2012F2013FKBANKSectorBAYBAY2014F2002 2003 2004 2005 2006 20072008 2009 2010 2
54、011TMBSCBKTBSCBKTBKKKKBBLBBLBANKING SECTORChart 9: Thai Banks 2012F Net profit growth70.0%Chart 10: Thai Banks 2013F Net profit growth45.0%60.0%57.2%40.0%38.8%35.2%49.6%35.0%50.0%43.8%30.0%26.4%40.0%30.0%30.0%24.6% 22.6%25.0%20.0%23.3% 22.9%21.5% 20.7%20.2%17.7%20.0%10.0%17.4%15.2% 15.0%11.4%15.0%10
55、.0%5.0%4.0%0.0%Source: Company reports and KELIVE Research estimates.0.0%Source: Company reports and KELIVE Research estimates.Thai banking ROEs have been on an upward trend since 2008, and wesee this trend continuing.Chart 11: Thai banks ROE20.0%18.0%16.0%14.0%12.0%10.0%8.0%6.0% 5.2%4.0%17.7%17.4%1
56、2.5%9.5%2.7%ROE on rising trend17.5%17.7%16.3%14.3%13.1%11.8%11.7%2.0%0.0%Source: Company reports and KELIVE Research estimates.Maintain OVERWEIGHT but becoming more selectiveWe maintain our POSITIVE view on the Thai banks on solid loans andearnings growth prospects and healthy balance sheets. Curre
57、ntly, theSETBANK is trading at 1.64x PBV (+1S.D. of its historic mean), whichis no longer cheap. However, with bright earnings growth prospectsand rising ROEs, the sector should be re-rated to higher PBV multiples,in our view.However, the YTD share price outperformance of the sector(SETBANK +36.6% v
58、s. SET +27.2%) would seem to reflect thesepositives somewhat. With limited upside for some banks, we thusprefer to be more selective in our stock picks.We choose SCB, TCAP and TISCO as medium-term (3-6 months)picks on expected strength in retail loans, especially in the auto hirepurchase sector, wit
59、h solid momentum to continue through the middleof next year at the very least. For the long-term (1-2 years), KTB is ourfavourite on expected acceleration of government borrowing and anundeserved valuation discount (details in KTB report dated 8 Oct2012).11 October 2012Page 7 of 12BANKING SECTORChar
60、t 12: Thai banks Ytd share price performanceChart 13: Thai Banks 1 month share price performanceTMBBBLSET IndexTISCOKTBSETBANKSCBBAYKBANKKKTCAP13.9%25.4%27.2%28.3%32.7%36.6%42.1%43.2%47.5%49.2%54.2%BAYBBLKBANKKKTMBSET IndexSETBANKSCBKTBTCAPTISCO-1.6%-0.5%2.9%3.8%4.0%4.7%5.5%7.5%9.4%17.0%17.5%0.0%10.
61、0%20.0%30.0%40.0%50.0%60.0%-5.0%0.0%5.0%10.0%15.0%20.0%Source: SET reportsChart 14: SETBANK 1yr forward PBVSource: SET reportsChart 15: Thai Banks PBV vs. ROE2.10PBV (X)SETBANK - PBV2.5013F PBV (x)SCB2.301.901.701.501.301.10Avg PBV = 1.41x+2SDCurrent PBV = 1.64x+1SDAvg-1SD2.101.901.701.501.30TMBExpe
62、nsive ZoneBAY SectorKTBKBANKTISCO0.90-2SD1.100.90KKBBLTCAPCheap Zone0.700.500.700.5013F ROE (%)200420052006200720082009201020112012F2013F7.09.011.013.015.017.019.021.023.025.0Source: SET, Company reports and KELIVE Research estimates.11 October 2012Source: SET, Company reports and KELIVE Research es
63、timates.Page 8 of 12BANKING SECTORRESEARCH OFFICESREGIONALP K BASURegional Head, Research & Economics(65) 6432 1821 pk.basumaybank-.sgWONG Chew Hann, CAActing Regional Head of Institutional Research(603) 2297 8686 wchewhmaybank-THAM Mun HonRegional Strategist(852) 2268 0630 .hkONG Seng YeowRegional
64、Products & Planning(852) 2268 0644 ongsengyeowmaybank-.sgECONOMICSSuhaimi ILIASChief Economist Singapore | Malaysia(603) 2297 8682 suhaimi_iliasmaybank-Luz LORENZOEconomist Philippines | Indonesia(63) 2 849 8836 luz_lorenzomaybank-MALAYSIAWONG Chew Hann, CA Head of Research(603) 2297 8686 wchewhmayb
65、ank- Strategy Construction & InfrastructureDesmond CHNG, ACA(603) 2297 8680 desmond.chngmaybank- Banking - RegionalLIAW Thong Jung(603) 2297 8688 tjliawmaybank- Oil & Gas Automotive ShippingONG Chee Ting, CA(603) 2297 8678 ct.ongmaybank- PlantationsMohshin AZIZ(603) 2297 8692 mohshin.azizmaybank- Av
66、iation Petrochem PowerYIN Shao Yang, CPA(603) 2297 8916 samuel.ymaybank- Gaming Regional Media PowerTAN CHI WEI, CFA(603) 2297 8690 chiwei.tmaybank- Construction & Infrastructure PowerWONG Wei Sum, CFA(603) 2297 8679 weisummaybank- Property & REITsLEE Yen Ling(603) 2297 8691 lee.ylmaybank- Building Materials Manufacturing TechnologyLEE Cheng Hooi Head of Retailchenghooi.leemaybank- TechnicalsHONG KONG / CHINAEdward FUNG Head of Research(852) 2268 0632 .hk ConstructionIvan CHEUNG(852) 2268 0634 .
- 温馨提示:
1: 本站所有资源如无特殊说明,都需要本地电脑安装OFFICE2007和PDF阅读器。图纸软件为CAD,CAXA,PROE,UG,SolidWorks等.压缩文件请下载最新的WinRAR软件解压。
2: 本站的文档不包含任何第三方提供的附件图纸等,如果需要附件,请联系上传者。文件的所有权益归上传用户所有。
3.本站RAR压缩包中若带图纸,网页内容里面会有图纸预览,若没有图纸预览就没有图纸。
4. 未经权益所有人同意不得将文件中的内容挪作商业或盈利用途。
5. 装配图网仅提供信息存储空间,仅对用户上传内容的表现方式做保护处理,对用户上传分享的文档内容本身不做任何修改或编辑,并不能对任何下载内容负责。
6. 下载文件中如有侵权或不适当内容,请与我们联系,我们立即纠正。
7. 本站不保证下载资源的准确性、安全性和完整性, 同时也不承担用户因使用这些下载资源对自己和他人造成任何形式的伤害或损失。
