 证券和组合课后习题:tb05

《证券和组合课后习题:tb05》由会员分享,可在线阅读,更多相关《证券和组合课后习题:tb05(15页珍藏版)》请在装配图网上搜索。
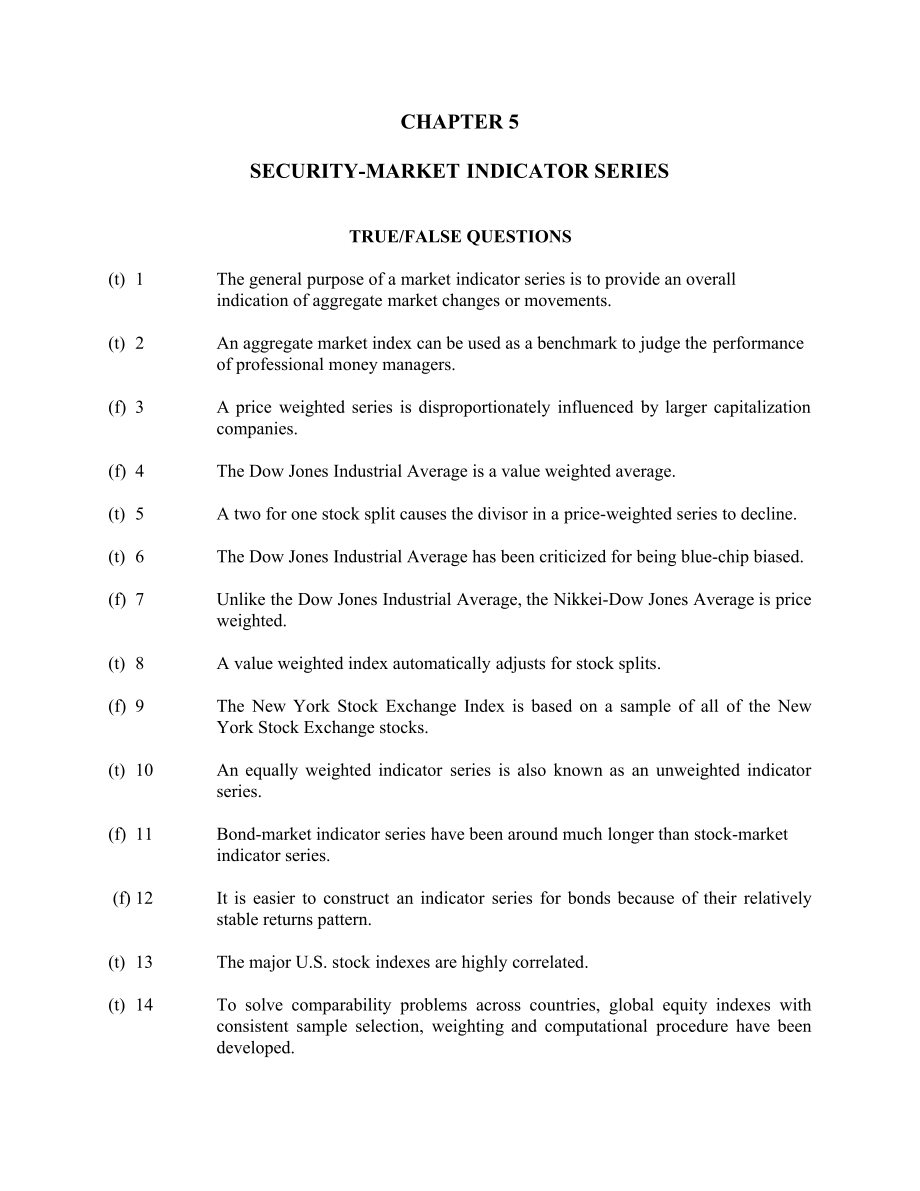
1、CHAPTER 5SECURITY-MARKET INDICATOR SERIESTRUE/FALSE QUESTIONS(t)1The general purpose of a market indicator series is to provide an overall indication of aggregate market changes or movements.(t)2An aggregate market index can be used as a benchmark to judge the performance of professional money manag
2、ers.(f)3A price weighted series is disproportionately influenced by larger capitalization companies.(f)4The Dow Jones Industrial Average is a value weighted average.(t)5A two for one stock split causes the divisor in a price-weighted series to decline.(t)6The Dow Jones Industrial Average has been cr
3、iticized for being blue-chip biased.(f)7Unlike the Dow Jones Industrial Average, the Nikkei-Dow Jones Average is price weighted.(t)8A value weighted index automatically adjusts for stock splits. (f)9The New York Stock Exchange Index is based on a sample of all of the New York Stock Exchange stocks.(
4、t)10An equally weighted indicator series is also known as an unweighted indicator series.(f)11Bond-market indicator series have been around much longer than stock-market indicator series. (f)12It is easier to construct an indicator series for bonds because of their relatively stable returns pattern.
5、(t)13The major U.S. stock indexes are highly correlated.(t)14To solve comparability problems across countries, global equity indexes with consistent sample selection, weighting and computational procedure have been developed.(f)15There are no composite series currently available that will measure th
6、e performance of all securities (i.e. stocks and bonds) in a given country.(f)16The NYSE series should have higher rates of return and risk measures than the AMEX and OTC series.(t)17There is a high correlation between the Wilshire 5000 index and the alternative NYSE series (S&P 500 and the NYSE), r
7、epresenting the substantial influence of large NYSE stocks on the Wilshire 5000 index. (t)18The low correlations between the U.S. and Japan, confirm the benefit of global diversification.(t)19The correlations among the U.S. investment-grade-bond series were very high because all rates of return for
8、investment-grade bonds over time are impacted by common macroeconomic variables.MULTIPLE CHOICE QUESTIONS(e)1Which of the following is not a use of security market indicator series?a)To use as a benchmark of individual portfolio performanceb)To develop an index portfolioc)To determine factors influe
9、ncing aggregate security price movementsd)To use in the measurement of systematic riske)To use in the measurement of diversifiable risk(a)2A properly selected sample for use in constructing a market indicator series will consider the samples source, size anda)Breadth.b)Average beta.c)Value.d)Variabi
10、lity.e)Dividend record.(c)3The Nikkei-Dow Jones Average is composed of _ stocks listed on the first section of the Tokyo Stock Exchange.a)30b)100c)225d)500e)1000(a)4What effect does a stock substitution or stock split have on a price-weighted series?a)Index remains the same, divisor will increase/de
11、crease.b)Divisor remains the same, index will increase/decrease.c)Index and divisor will both remain the same.d)Index and divisor will both reflect the changes (immediately).e)Not enough information is provided.(b)5Which of the following is not a value-weighted series?a)NASDAQ Industrial Indexb)Dow
12、Jones Industrial Averagec)Wilshire 5000 Equity Indexd)American Stock Exchange Seriese)NASDAQ Composite Index(c)6An example of a value weighted stock market indicator series is thea)Dow Jones Industrial Average.b)Nikkei Dow Jones Average.c)S & P 500 Index.d)Value Line Index.e)Shearson Lehman Hutton I
13、ndex.(c)7A criticism of a value weighted index is thata)They are subject to exchange rate fluctuations.b)They are not useful for the OTC market.c)Large companies have a disproportionate influence on the index.d)Small companies have an exaggerated effect on the index.e) None of the above(e)8Of the fo
14、llowing indices, which includes the most comprehensive list of stocks?a)New York Exchange Indexb)Standard and Poors Indexc)American Stock Exchange Indexd)NASDAQ Series Indexe)Wilshire Equity Index(d)9The Value Line Composite Average is calculated using the _ of percentage price changes. a)arithmetic
15、 averageb)harmonic averagec)expected valued)geometric averagee)logarithmic average(d)10Which of the following is not a global equity indicator series?a)Morgan Stanley Capital International Indexesb)Dow Jones World Stock Index c)FT/S & P-Actuaries World Indexesd)Merrill Lynch-Wilshire World Indexese)
16、None of the above (that is, each is a global equity indicator series)(a)11The Ryan Index is an example of a a)Bond market indicator series.b)Stock market indicator series.c)Composite security market series.d)World market series.e)Commodity market series.(e)12To qualify for inclusion in the Merrill L
17、ynch Convertible Securities Indexes a security must:a)be a public U.S. corporate issue.b)have a maturity of at least one year.c)have a minimum par value of $25 million.d)Choices b and c onlye)All of the above(a)13Which of the following is true of the various market index series?a)A low correlation e
18、xists between the U.S. indexes and those of Japan.b)The NYSE series have higher rates of return and risk measures than the AMEX and OTC series.c)A low correlation exists between alternative series that include almost all NYSE stocks.d)A low correlation exists between alternative bond series.e)None o
19、f the above (e) 14 Which of the following are factors that make it difficult to create and maintain a bond index?a) The universe of bonds is broader than stocks.b) The universe of bonds is constantly changing due to new issues, bond maturities, calls, and bond sinking funds.c) It is difficult to der
20、ive value, up-to-date prices.d) Choices a and ce) All of the above(e) 15Which of the following is not a U.S. investment-grade bond index?a) Merrill Lynch b) Ryan Treasury c) Salomon Brothers d) Lehman Brothers e) None of the above (that is, all are U.S. investment-grade bond indexes)(d) 16The follow
21、ing are examples of Style Indexesa) Small-cap growthb) Mid-cap valuec) Small-cap valued) All of the abovee) None of the aboveMULTIPLE CHOICE PROBLEMSUSE THE FOLLOWING INFORMATION FOR THE NEXT THREE PROBLEMSNumber of sharesClosing Prices(per share)CompaniesoutstandingDay TDay T + 112,000$30.00$35.002
22、6,00055.0050.0033,00022.5025.0044,00040.0042.50(a)1Assume that a stock price-weighted indicator consisted of the four issues with their prices. What are the values for the Day T and T + 1 and what is the change? a)36.875, 38.125, +1.25b)38.125, 36.875, -1.25c)61.750, 61.500, -4.05d)61.500, 61.750, +
23、4.05e)None of the above(c)2For a value-weighted series, assume that Day T is the base period and the base value is 50. What is the new index value for Day T + 1 and how has the index changed from Day T?a)50.203, +0.203b)51.695, +1.695c)49.800, -0.200d)48.361, -1.639e)None of the above(d)3Assume that
24、 an investor had $4,000 to invest, compute an unweighted price indicator series. What is the percentage change in wealth for this portfolio?a.-6.23%b.-5.86%c.+1.06%d.+6.23%e)None of the aboveUSE THE FOLLOWING INFORMATION FOR THE NEXT TEN PROBLEMSStock Price# SharesXYZXYZJan. 13, 19992540301000200010
25、00*Jan. 14, 199925427100020005000Jan. 15, 1999274281000*20005000Jan. 16, 1999144410200020005000*5:1 Split on Stock Z after Close on Jan. 13, 1999*2:1 Split on Stock X after Close on Jan. 15, 1999(b)4Calculate a price weighted index for January 13th.a) 3.16b) 31.67c) 30.67d)100.00e)None of the above(
26、b)5What is the divisor at the beginning of January 14th?a)22.4190b) 2.2419c) 2.2734d)22.7340e)None of the above(d)6Calculate a price weighted index for January 14th.a) 3.17b)24.66c)31.72d)32.12e)None of the above(c)7Calculate a price weighed index for January 15th.a)31.67b)22.33c)34.35d)33.87e)None
27、of the above(a)8What is the divisor at the beginning of January 16th?a)1.8486b)1.8896c)1.8632d)1.8748e)None of the above(d)9Calculate a price weighted index for January 16th.a)42.87b)43.47c)43.20d)43.82e)None of the above(b)10Calculate a value weighted index for Jan. 13th if the initial index value
28、is 100.a)1.0b)100c)135d)$135,000e)None of the above(d)11Calculate a value weighted index for Jan. 14th if the initial index value is 100.a)135,000b)144,000c)100.000d)106.667e) 1.067(a)12Calculate a value weighted index for January 15th if the initial index value is 100.a) 111.8500b) 151.0000c) 100.0
29、000d) 1.1185e) $151,000(a)13Calculate a value weighted index for January 16th if the initial index value is 100.a) 122.96b) 100.00 c) 166.00d) 1.66e) $166,000USE THE FOLLOWING INFORMATION FOR THE NEXT TWO PROBLEMS Year% Price Change for Goober Industries199510.0%199612.0%199710.0%199811.0%1999 6.0%(
30、b)14Calculate the average annual rate of change for Goober for the 5 year period using the arithmetic mean.a) 0.098%b) 9.80%c) 8.50% d) 8.00%e) 89.00%(a)15Calculate the average annual rate of change for Goober for the 5 year period using the geometric mean.a)9.7800%b)0.0978%c)9.0700%d)0.0970%e)3.640
31、0%USE THE FOLLOWING INFORMATION FOR THE NEXT TWO PROBLEMSYear% Price Change for Stock Index1995 8.0%1996 10.0%1997-14.0%1998 20.0%1999-10.0%(c)16Calculate the average annual rate of change for this index for the 5 year period using the arithmetic mean.a)0.28%b)1.28%c)2.80%d)3.58%e)6.38%(b)17Calculat
32、e the average annual rate of change for this index for the 5 year period using the geometric mean.a)0.09%b)1.99%c)3.99%d)4.50%e)4.67%USE THE FOLLOWING INFORMATION FOR THE NEXT 12 PROBLEMS 31-Dec-0031-Dec-0031-Dec-0131-Dec-01StockPriceSharesPriceSharesW $ 75.00 10000 $ 50.00 20000X $ 150.00 5000 $ 65
33、.00 10000Y $ 25.00 20000 $ 35.00 20000Z $ 40.00 25000 $ 50.00 25000Stocks W and X had 2 for 1 splits on January 1, 2001.(c) 18Calculate the price weighted series for Dec 31, 2000, prior to the splits. a) 81.69 b) 100.0 c) 72.5 d) 121.25 e) 119.25(a) 19Calculate the price weighted series for Dec 31,
34、2000, after the splits. a) 72.5 b) 100.0 c) 119.25 d) 121.25 e) 81.69(e) 20Calculate the price weighted series for Dec 31, 2001. a) 121.25 b) 119.25 c) 100.0 d) 72.5 e) 81.69(a) 21Calculate the percentage return in the price weighted series for the period Dec 31, 2000 to Dec 31, 2001. a) 12.68% b) 2
35、0.00% c) 21.76% d) 33.33% e) 40.00%(d) 22Calculate the value weighted index for Dec 31, 2000, prior to the splits. Assume a base index value of 100. The base year is Dec 31, 2000. a) 120.0 b) 81.69 c) 72.5 d) 100.0 e) 121.25(c) 23 Calculate the value weighted index for Dec 31, 2000, after the splits
36、. Assume a base index value of 100. The base year is Dec 31, 2000. a) 72.5 b) 81.69 c) 100.0 d) 120.0 e) 121.25(e) 24 Calculate the value weighted index for Dec 31, 2001. Assume a base index valueof 100. The base year is Dec 31, 2000. a) 121.25 b) 100.0 c) 81.69 d) 72.5 e) 120.0(b) 25 Calculate the
37、percentage return in the value weighted index for the period Dec 31, 2000 to Dec 31, 2001. a) 12.68% b) 20.00% c) 21.76% d) 33.33% e) 40.00%(a) 26 Calculate the unweighted index for Dec 31, 2000, prior to the splits. Assume a base index value of 100. The base year is Dec 31, 2000. a) 100.0 b) 200.0
38、c) 150.0 d) 120.0 e) 175.0(c) 27 Calculate the unweighted index for Dec 31, 2000, after the splits. Assume a baseindex value of 100. The base year is Dec 31, 2000. a) 110.0 b) 200.0 c) 100.0 d) 120.0 e) 150.0(a) 28 Calculate the unweighted index (geometric mean) for Dec 31, 2001. Assume a base index
39、 value of 100. The base year is Dec 31, 2000. a) 119.25 b) 121.25 c) 151.25 d) 95.25 e) 100.25(a) 29 Calculate the percentage return in the unweighted index (geometric mean) for theperiod Dec 31, 2000 to Dec 31, 2001. Assume a base index value of 100. The baseyear is Dec 31, 2000. a) 19.25% b) 21.25
40、% c) 51.25% d) 5.25% e) 100.25%CHAPTER 5ANSWERS TO PROBLEMS1Closing Prices(per share)CompaniesDay TDay T + 1130.0035.00255.0050.00322.5025.00440.0042.504 147.504 152.5036.875 38.125Therefore the index closed up 1.25 (+1.25)2 Number of sharesPriceCompaniesoutstandingDay TMarket value12,00030.0060,000
41、26,00055.00330,00033,00022.5067,50044,00040.00160,000617,500Base value equal to an index of 50Number of sharesPriceCompaniesoutstandingDay T + 1Market value12,00035.0070,00026,00050.00300,00033,00025.0075,00044,00042.50170,000615,000Therefore the index closed down .20 (-.20)3PriceNumberCompaniesDay
42、Tof sharesMarket value130.0033.331,000.00255.0018.181,000.00322.5044.441,000.00440.0025.001,000.004,000.00PriceNumberCompaniesDay T + 1of sharesMarket value135.0033.331,166.55250.0018.18909.00325.00 44.441.111.00442.5025.001,062.504,249.054January 13 index = (25 + 40 + 30) 3 = 31.675January 14 adjus
43、ted divisor = (25 + 40 + 6) X = 31.67X = 2.24196January 14 index = (25 + 40 + 7) 2.2419 = 32.127January 15 index = (27 + 42 + 8) 2.2419 = 34.358January 16 divisor = (13.5 + 42 + 8) X = 34.35X = 1.84869January 16 index = (27 + 44 + 10) 1.8486 = 43.8210January 13 index = 100 by definition11Base Value
44、= (25)(1000) + (4)(2000)(30)(1000) = $135,000January 14 Value = (25)(1000) + (42)(2000) + (7)(5000) = 144,000Index = (144,000 135,000) x 100= 106.6712January 15 Value = (27)(1000) + (42)(2000) + (8)(5000) = 151,000Index = (151,000 135,000) x 100= 111.8513January 16 Value = (14)(2000) + (44)(2000) +
45、(10)(5000) = 166,000Index = (166,000 135,000) x 100= 122.9614 The Arithmetic Average is: (10 + 12 + 10 + 11 + 6) 5 = 9.8%15The Geometric Average is: (1.10)(1.12)(1.10)(1.11)(1.06)1/5 - 1 = 9.78%16The Arithmetic Average is: (8 + 10 - 14 + 20 - 10) 5 = 2.8%17The Geometric Average is: (1.08)(1.10)(.86)
46、(1.20)(.9)1/5 - 1 = 1.99%18Price weighted series Dec 2000 =(75 + 150 + 25 + 40)/4 = 72.519Post split series = 72.5 = (37.5 + 75 + 25 + 40)/XThe new divisor, X = 2.4483.20 Price weighted series Dec 2001 = (50 + 65 + 35 + 50)/2.4483 = 81.6921Return on series = (81.69 72.5)/72.5 = 12.68%22Value weighte
47、d series Dec 2000 =23Value weighted post split = 100. Not affected by splits.24Value weighted series Dec 2000 =25 Since the base value is 100 and the current index value is120, the percentage return is 20%.26The index value Dec 2000 is 10027Post split the index value is 10028 Index Dec 2001 = (1.33 + 0.87 + 1.40 + 1.25)1/4 (100)= 119.2529The return on the index is 19.25%
- 温馨提示:
1: 本站所有资源如无特殊说明,都需要本地电脑安装OFFICE2007和PDF阅读器。图纸软件为CAD,CAXA,PROE,UG,SolidWorks等.压缩文件请下载最新的WinRAR软件解压。
2: 本站的文档不包含任何第三方提供的附件图纸等,如果需要附件,请联系上传者。文件的所有权益归上传用户所有。
3.本站RAR压缩包中若带图纸,网页内容里面会有图纸预览,若没有图纸预览就没有图纸。
4. 未经权益所有人同意不得将文件中的内容挪作商业或盈利用途。
5. 装配图网仅提供信息存储空间,仅对用户上传内容的表现方式做保护处理,对用户上传分享的文档内容本身不做任何修改或编辑,并不能对任何下载内容负责。
6. 下载文件中如有侵权或不适当内容,请与我们联系,我们立即纠正。
7. 本站不保证下载资源的准确性、安全性和完整性, 同时也不承担用户因使用这些下载资源对自己和他人造成任何形式的伤害或损失。
