 高级英语视听说教程第二册听力文本


《高级英语视听说教程第二册听力文本》由会员分享,可在线阅读,更多相关《高级英语视听说教程第二册听力文本(28页珍藏版)》请在装配图网上搜索。
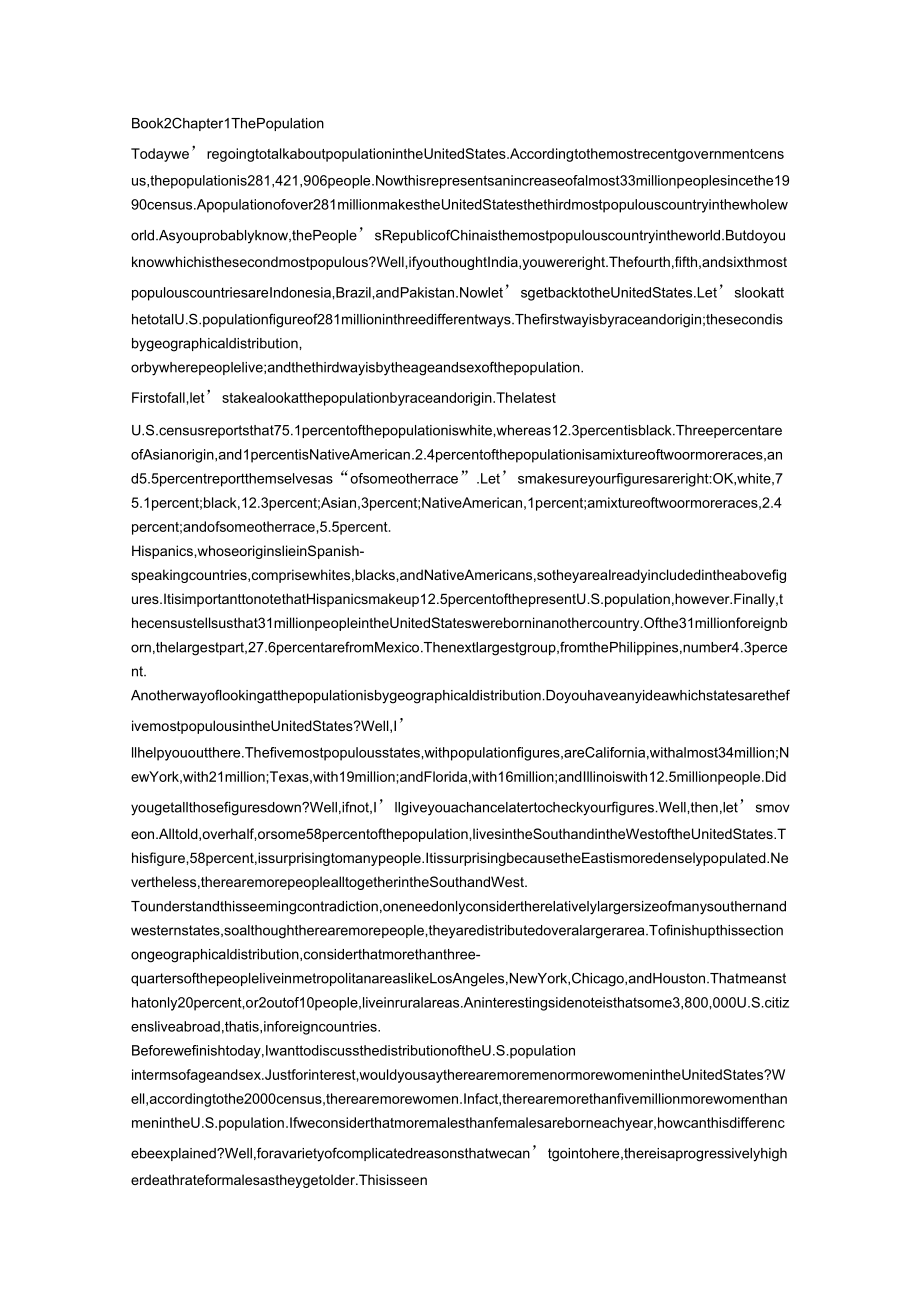
1、Book2Chapter1ThePopulationTodayweregoingtotalkaboutpopulationintheUnitedStates.Accordingtothemostrecentgovernmentcensus,thepopulationis281,421,906people.Nowthisrepresentsanincreaseofalmost33millionpeoplesincethe1990census.Apopulationofover281millionmakestheUnitedStatesthethirdmostpopulouscountryinth
2、ewholeworld.Asyouprobablyknow,thePeoplesRepublicofChinaisthemostpopulouscountryintheworld.Butdoyouknowwhichisthesecondmostpopulous?Well,ifyouthoughtIndia,youwereright.Thefourth,fifth,andsixthmostpopulouscountriesareIndonesia,Brazil,andPakistan.NowletsgetbacktotheUnitedStates.LetslookatthetotalU.S.po
3、pulationfigureof281millioninthreedifferentways.Thefirstwayisbyraceandorigin;thesecondisbygeographicaldistribution,orbywherepeoplelive;andthethirdwayisbytheageandsexofthepopulation.Firstofall,letstakealookatthepopulationbyraceandorigin.ThelatestU.S.censusreportsthat75.1percentofthepopulationiswhite,w
4、hereas12.3percentisblack.ThreepercentareofAsianorigin,and1percentisNativeAmerican.2.4percentofthepopulationisamixtureoftwoormoreraces,and5.5percentreportthemselvesas“ofsomeotherrace”.Letsmakesureyourfiguresareright:OK,white,75.1percent;black,12.3percent;Asian,3percent;NativeAmerican,1percent;amixtur
5、eoftwoormoreraces,2.4percent;andofsomeotherrace,5.5percent.Hispanics,whoseoriginslieinSpanish-speakingcountries,comprisewhites,blacks,andNativeAmericans,sotheyarealreadyincludedintheabovefigures.ItisimportanttonotethatHispanicsmakeup12.5percentofthepresentU.S.population,however.Finally,thecensustell
6、susthat31millionpeopleintheUnitedStateswereborninanothercountry.Ofthe31millionforeignborn,thelargestpart,27.6percentarefromMexico.Thenextlargestgroup,fromthePhilippines,number4.3percent.Anotherwayoflookingatthepopulationisbygeographicaldistribution.Doyouhaveanyideawhichstatesarethefivemostpopulousin
7、theUnitedStates?Well,Illhelpyououtthere.Thefivemostpopulousstates,withpopulationfigures,areCalifornia,withalmost34million;NewYork,with21million;Texas,with19million;andFlorida,with16million;andIllinoiswith12.5millionpeople.Didyougetallthosefiguresdown?Well,ifnot,Illgiveyouachancelatertocheckyourfigur
8、es.Well,then,letsmoveon.Alltold,overhalf,orsome58percentofthepopulation,livesintheSouthandintheWestoftheUnitedStates.Thisfigure,58percent,issurprisingtomanypeople.ItissurprisingbecausetheEastismoredenselypopulated.Nevertheless,therearemorepeoplealltogetherintheSouthandWest.Tounderstandthisseemingcon
9、tradiction,oneneedonlyconsidertherelativelylargersizeofmanysouthernandwesternstates,soalthoughtherearemorepeople,theyaredistributedoveralargerarea.Tofinishupthissectionongeographicaldistribution,considerthatmorethanthree-quartersofthepeopleliveinmetropolitanareaslikeLosAngeles,NewYork,Chicago,andHou
10、ston.Thatmeansthatonly20percent,or2outof10people,liveinruralareas.Aninterestingsidenoteisthatsome3,800,000U.S.citizensliveabroad,thatis,inforeigncountries.Beforewefinishtoday,IwanttodiscussthedistributionoftheU.S.populationintermsofageandsex.Justforinterest,wouldyousaytherearemoremenormorewomeninthe
11、UnitedStates?Well,accordingtothe2000census,therearemorewomen.Infact,therearemorethanfivemillionmorewomenthanmenintheU.S.population.Ifweconsiderthatmoremalesthanfemalesareborneachyear,howcanthisdifferencebeexplained?Well,foravarietyofcomplicatedreasonsthatwecantgointohere,thereisaprogressivelyhigherd
12、eathrateformalesastheygetolder.Thisisseenin2003lifeexpectancyfigures:thelifeexpectancyforwomenis80.4yearswhereasformenitisonly74.5years.Idontknowhowtheselifeexpectancyfigurescomparetothoseinyourcountries,butstatisticallywomengenerallylivelongerthanmenworldwide.Now,tofinishup,letslookattheaverageageo
13、fthewholepopulation.Overall,theaverageageofthepopulationisincreasing:from33.1yearsin1990to35.3yearsin2000.Theaverageagehasbeenslowly,butsteadily,increasingoverthepastseveraldecades.Thistrendtowardahigheraverageagecanbeexplainedbyadecreasingbirthrateandanincreasinglifeexpectancyforthepopulationasawho
14、le.Well,Idliketoinvestigatethesetwosubjectsfurther,butIseeourtimeisup,sowellhavetocallitquitsfortoday.YoumaywanttopursuethetopicoftheagingU.S.populationfurther,sotherearesomesuggestionsattheendofthelessontohelpyoudoso.Thankyou.ChapterTwoImmigration:PastandPresentTheactofimmigrating,orcomingtoanewcou
15、ntrytolive,iscertainlynothingnew.Throughouthistory,peoplehaveimmigrated,ormovedtonewcountries,formanydifferentreasons.Sometimesthesereasonswereeconomicorpolitical.Otherpeoplemovedbecauseofnaturaldisasterssuchasdroughtsorfamines.Andsomepeoplemovedtoescapereligiousorpoliticalpersecution.Nomatterwhatth
16、ereason,mostpeopledonotwanttoleavetheirnativelandanddosoonlyundergreatpressureofsomesort,butafewpeopleseemquiteadventuresomeandrestlessbynatureandliketomovealot.ItseemsbothkindsofpeoplecametoAmericatolive.ThesubjectofimmigrationisquitefascinatingtomostAmericans,astheyviewthemselvesasanationofimmigra
17、nts.However,theearlyBritonswhocametowhatistodaytheUnitedStatesconsideredthemselves“settlers”or“colonists,”ratherthanimmigrants.Thesepeopledidnotexactlythinktheyweremovingtoanewcountrybutweremerelysettlingnewlandforthe“mothercountry.”TherewerealsolargenumbersofDutch,French,German,andScotch-Irishsettl
18、ers,aswellaslargenumbersofblacksbroughtfromAfricaasslaves.AtthetimeofindependencefromBritainin1776,about40percentofpeoplelivinginwhatisnowtheUnitedStateswerenon-British.Themajorityofpeople,however,spokeEnglish,andthetraditionsthatformedthebasisoflifeweremainlyBritishtraditions.Thisperiodwehavejustbe
19、endiscussingisusuallyreferredtoastheColonialPeriod.Today,werealittlemoreinterestedinactualimmigrationafterthisperiod.LetsfirstlookatwhatisoftencalledtheGreatImmigration,whichbeganabout1830andendedin1930.Thenletsconsiderthereasonsforthisso-calledGreatImmigrationandthereasonsitended.Finally,letstalkab
20、outtheimmigrationsituationintheUnitedStatestoday,AsIsaid,wellbeginourdiscussiontodaywiththeperiodofhistorycalledtheGreatImmigration,whichlastedfromapproximately1830to1930.ItwillbeeasierifwelookattheGreatImmigrationintermsofthreemajorstages,ortimeperiods.Thefirststagewasfromapproximate1y1830to1860.No
21、w,beforethistime,thenumberofimmigrantscomingtotheUnitedStateswascomparativelysmall,onlyabout10,000ayear.However,theratebegantoclimbinthe1830swhenabout600,000immigrantsarrived.Theratecontinuedtoclimbduringthe1840swithatota1of1,700,000peoplearrivinginthatdecade.Theratecontinuedtoclimb,andduringthe1850
22、s2,600,000immigrantsarrived.DuringthisfirststageoftheGreatImmigration,thatis,betweentheyears1830and1860,themajorityofimmigrantscamefromGermany,GreatBritain,andIreland.NowletsconsiderthesecondstageoftheGreatImmigration.Thesecondstagewasfroml860to1890,duringwhichtimeanother10,000,000peoplearrived.Betw
23、eenl860and1890themajorityofimmigrantscontinuedtobefromGermany,Ireland,andGreatBritain.However,duringthesecondstage,asmallerbutsignificantnumberofimmigrantscamefromtheScandinaviannationsofDenmark,NorwayandSweden.ThethirdstageoftheGreatImmigration,whichlastedfrom1890to1930,wastheeraofheaviestimmigrati
24、on.Betweentheyearsl890andl930,almost22millionimmigrantsarrivedintheUnitedStates.MostofthesenewarrivalscamefromtheSouthernEuropeancountriesofGreece,Italy,Portugal,andSpainandtheEasternEuropeancountriesofPolandandRussia.NowthatweknowsomethingaboutthenumbersandoriginsofimmigrantswhocametotheStatesdurin
25、gtheGreatImmigration,letsconsiderthereasonswhymostofthesepeopleimmigratedtotheUnitedStates.WhydidsuchlargenumbersofEuropeansleavetheirhomesforlifeinanunknowncountry?Itwouldbeimpossibletodiscussallthecomplexpoliticalandeconomicreasonsinanydepthtoday,butwecantouchonafewinterestingfactsthatmighthelptoc
26、larifythesituationforyou.Firstofall,oneofthemostimportantreasonswasthatthepopulationofEuropedoubledbetweentheyears1750and1850.Atthesametimethatthepopulationwasgrowingsorapidly,theIndustrialRevolutioninEuropewascausingwidespreadunemployment.Thecombinationofincreasedpopulationandthedemandforlandbyindu
27、stryalsomeantthatfarmlandwasbecomingincreasinglyscarceinEurope.ThescarcityoffarmlandinEuropemeantthattheabundanceofavailablelandinthegrowingcountryoftheUnitedStateswasagreatattraction.Duringtheseyears,theUnitedStateswasanexpandingcountryanditseemedthattherewasnoendtoland.Infact,in1862,thegovernmento
28、fferedpubliclandfreetocitizensandtoimmigrantswhowereplanningtobecomecitizens.Inadditiontoavailablefarmland,therewerealsoplentifuljobsduringtheseyearsofgreateconomicgrowth.Otherattractionswerefreedomfromreligiousorpoliticalpersecution.SomeothergroupsalsocametotheUnitedStatesasthedirectresultsofnatura
29、ldisastersthatleftthemindesperatesituations.Forexample,thefrequentfailureofthepotatocropinIrelandbetweentheyears1845and1849ledtowidespreadstarvationinthatcountry,andpeopleweredriventoimmigrate.AnotherfactorthataffectedthenumberofimmigrantscomingtotheUnitedStateswasimprovedoceantransportbeginninginth
30、e1840s.Atthattime,shipslargeenoughtocarrylargenumbersofpeoplebegantomakeregulartripsacrosstheocean.NowletssummarizethereasonsforthehighrateofimmigrationtotheUnitedStatesduringtheyearswediscussed:first,thedoublingofthepopulationinEuropebetween1750and1850;second,theunemploymentcausedbytheIndustrialRev
31、olution;andthird,thelandscarcityinEurope,followedbyreligiousandpoliticalpersecutionandnaturaldisaster.Thesereasonscombinedwithimprovedtransportationprobablyaccountforthelargestnumberofimmigrants.IwouldnowliketotalkbrieflyabouttheperiodoftimefollowingtheGreatImmigrationandthereasonsforthedeclineinthe
32、rateofimmigration.Althoughimmigrationcontinuestoday,immigrationnumbershaveneveragainreachedthelevelsthatwediscussedpreviously.Thereareseveralreasonsforthisdecline.ThisdeclinewasinpartduetovariouslawswhoseaimwastolimitthenumberofimmigrantscomingfromdifferentpartsoftheworldtotheUnitedStates.Thefirstsu
33、chlawthatlimitedthenumberofimmigrantscomingfromacertainpartoftheworldwastheChineseExclusionActof1882.Thislawwasfollowedbymanyotherlawsthatalsotriedtolimitthenumbersofpeopleimmigratingfromvariouscountriesorpartsoftheworld.Inadditiontosuchlaws,certainlyeconomicandgeopoliticaleventsasimportantastheGrea
34、tDepressionstartingin1929andWorldWarIIalsocontributedtothedeclineinimmigration.Letsconcludeourtalkbydiscussingthecurrentsituationwithrespecttoimmigration,whichisquitedifferentfromthatinthepast.Tounderstandsomeofthechanges,itsimportanttonotethatin1965strictquotasbasedonnationalitywereeliminated.Letss
35、eehowdifferentthingsaretodayfromthepast.AsInoted,thegreatestnumberofimmigrantstotheUnitedStateshavehistoricallybeenEuropean.AccordingtoU.S.Censusfigures,in1860,thepercentageofimmigrantsthatwereEuropeanwas92percent.Butby1960,thepercentageofEuropeanimmigrantshaddroppedto74.5percent,andbytheyear2002,it
36、haddroppedto14percent!In2002,52.2percentofimmigrantscamefromLatinAmerica,thatis,fromtheCaribbean,CentralAmerica,andSouthAmerica.MexicoisordinarilyconsideredpartofNorthAmerica,buttheU.S.CensusBureauconsidersMexicoasaCentralAmericancountryintermsofimmigrationstatistics,andestimatesthatmorethanone-thir
37、dofthetotalofallimmigrantstotheUnitedStatesin2002camefromMexicooranotherCentralAmericancountry.Thenextlargestpercentage,25.5percent,ofimmigrantscamefromAsia,mainlyfromthePhilippines,China,andIndia.AlthoughimmigrationdroppedsharplywhentheUnitedStatesenteredWorldWarIandremainedlowthroughouttheDepressi
38、onandWorldWarIIyears,attheendofthel940s,immigrationbegantoincreaseagainandhas,ingeneral,risensteadilysincethen.ItmightsurpriseyoutoknowthattheactualnumberofimmigrantscomingyearlytotheStatesinrecentyearsisaboutthesameasthenumberscomingyearlybetween1900and1910.Keepinmind,though,thatthepopulationoftheU
39、nitedStatesismuchlargernowthanattheturnofthecentury,sothatwhiletheyearlynumbersmaybesimilar,thepercentageofthepopulationthatisforeign-bornisconsiderablysmallertodaythanitwasacenturyago.Itmightbeinterestingtospeculateonimmigrationinthefuture.Willthetrendcontinuefornon-EuropeanstoimmigratetotheUnitedS
40、tates?Theanswerisprobablyyesfortheforeseeablefuture.Dothesenon-EuropeanpeoplecometotheUnitedStatesforthesamereasonsthatEuropeanscame?Well,landisnolongerplentifulandcheap.Industrynolongerrequireslargenumbersofunskilledworkers.Infact,thegovernmentusuallytriestorestrictimmigrationtothosepeoplewhoalread
41、yhavetheskillstobesuccessfulinU.S.society.Still,peoplecomeforpolitica1andeconomicreasonsandprobablywillcontinuetodoso.Chapter 3 AmericansatWorkWhetheryouloveitorhateit,workisamajorpartofmostpeoplesliveseverywhereintheworld.Americansarenoexception.Americansmightcomplainabout“blueMonday,”whentheyhavet
42、ogobacktoworkaftertheweekend,butmostpeopleputalotofimportanceontheirjob,notonlyintermsofmoneybutalsointermsofidentity.Infact,whenAmericansareintroducedtoanewperson,theyalmostalwaysaskeachother,“Whatdoyoudo?”Theyareasking,whatisyourjoborprofession.Today,however,wewontlookatworkintermsofwhatworkmeanss
43、ociallyorpsychologically.Rather,weregoingtotakealookatworkintheUnitedStatestodayfromtwoperspectives.First,welltakeahistoricallookatworkinAmerica.WelldothatbylookingathowthingschangedfortheAmericanworkerfromthebeginningtotheendofthetwentiethcentury,thatis,fromtheyear1900totheyear1999.Thenwelllookatho
44、wU.S.workersaredoingtoday.Aswelookatthechangesoverthelastcentury,weregoingtousealotofstatisticstodescribethesechanges.Youwillneedtowritedownalotofnumbersintodayslecture.First,letsconsiderhowthetypeofworkpeoplewereinvolvedinchanged.Atthebeginningofthetwentiethcentury,about38percentoftheworkforcewasin
45、volvedinagriculture;thatis,theyworkedonafarm.Bytheendofthecentury,only3percentstillworkedonfarms.Therewasalsoalargedecreaseinthenumberofpeopleworkinginmining,manufacturing,andconstruction.Thenumberofworkersinmining,manufacturing,andconstructionwentdownfrom31percentto19percent.Whilethenumberofpeoplei
46、nthesegoodsproducingindustrieswentdown,thenumberofpeopleintheserviceindustrieswentup.Asyoumayknow,aserviceindustryisonethatprovidesaservice,ratherthangoodsorproducts.Afewexamplesincludetransportation,tourism,banking,advertising,healthcare,andlegalservices.Imsureyoucanthinkofmore.Theserviceindustrywo
47、rkforcejumpedfrom31percentoftheworkforceattheturnofthecenturyto78percentin1999.Letsrecapthenumbers:in1900,38percentinagriculture;31percentinmining,manufacturing,andconstruction;and31percentintheserviceindustries.Thatshouldaddupto100percent.In1999,3percentinagriculture;19percentinmining,manufacturing
48、,andconstruction;and78percentintheserviceindustries.Again,thatshouldaddupto100percent.Thelaborforcechangedinotherimportantways.Forexample,childlaborwasnotunusualatthebeginningofthetwentiethcentury.In1900therewere1,750,000childrenagedtentofifteenworkingfull-timeinthelaborforce.Thiswas6percentofthelab
49、orforce.Overtheyears,childlaborlawsbecamemuchstricterandby1999,itwasillegalforanyoneundersixteentoworkfull-timeinanyofthefiftystates.Whilethenumberofchildrenintheworkforcewentdown,thenumberofwomenwentupdramatically.In1900,only19percentofwomenwereemployed;in1999,60percentofwomenwereholdingdownjobs.Le
50、tsseewhathashappenedtowagesandsalaries.AllthenumbersIwillgiveyouareintermsof1999dollars.Letmeexplain.In1900theaveragepercapitaincomewas$4,200ayear.Thatdoesnotmeanthattheaverageworkerin1900earned$4,200,ayear,butthatwhatheorsheearnedwasequalto$4,200in1999.Thatis,theamountofmoneytheaverageworkerearnedi
51、n1900wasworththesameas$4,200in1999.Theaveragepercapitaincomein1999was$33,700.Notonlydidpeopleearnalotmoremoneyattheendofthecentury,theyalsoreceivedalotmoreinbenefitsthanatthebeginningofthecentury.Oneoftheimportantbenefitsmostworkersreceivedlaterinthecenturywashealthinsurance.Whereaswagesandsalariesr
52、oseoverthecentury,theaverageworkweekdropped.Thatis,workers,ingeneral,didnotworkaslonghoursin1999astheydidin1900.ThelastareathatIdliketogiveyouafewstatisticsaboutisworkplacesafety.Mostofuswhogotoworkeverydaydontthinkalotaboutwhetherwearesafeornot,butin1900itwasarealconcernforalotofworkers.Therearentm
53、anystatisticsavailable,buttheU.S.governmentdoeshavestatisticsontwoindustriesthatwillgiveyousomeideaofthedifferencestoday.In1900almost1,500workerswerekilledincoal-miningaccidents;in1999,thenumberwas35.2,555railroadworkerswerekilledin1900,comparedto56in1999.Peopleoftentendtoromanticizethepastandtalkab
54、out“thegoodolddays,”butIthinkitsfairtosaythatbytheendofthetwentiethcentury,U.S.workersingeneralmademoremoney,theyenjoyedmorebenefits,andtheirworkingconditionshadimprovedgreatly.NowletsturnourattentiontothecurrentsituationforU.S.workers.ThepictureisnotsorosyastheonedrawnbycomparingU.S.workersatthebeg
55、inningandtheendofthetwentiethcentury.Imgoingtofocusonthecurrentsituationintermsofproductivity,workinghours,andwagesandsalaries.Firstletsconsiderthenumberofhoursworked.Accordingtoa2003studyreleasedbytheUnitedNationsInternationalLaborOrganization,U.S.workersarethemostproductiveintheworldamongindustria
56、lizednations,buttheyworklongerhoursthanEuropeanworkerstoachievethisproductivity.Europeanstypicallyhavefourtosixweeksofvacationayear,whereastheaverageAmericanworkerhasonlyabouttwoweeks.ThisstudypointsoutthatthelongerworkinghoursintheUnitedStatesisarisingtrend,whilethetrendinotherindustrializedcountri
57、esistheopposite.WorkersinsomeEuropeancountriesactuallyoutproduceAmericanworkersperhourofwork.IthasbeensuggestedthatthishigherrateofproductivitymightbebecauseEuropeanworkersarelessstressedthanU.S.workers.Atanyrate,thereseemstobegeneralagreementthatU.S.productivityhasgreatlyincreasedoverthelastthirtyy
58、ears.However,workershavenotseentheirwagesriseatthesamerate.AgroupofsociologistsintheirbookInequalitybyDesignpointoutthatthereisagrowinggapbetweenrichAmericansandeveryoneelseintheUnitedStates.Theywritethatbetween1949and1974,increasesinproductivitywerematchedbyincreasesinwagesforworkersinbothmanufactu
59、ringandtheserviceindustries,butsince1974,productivityincreased68percentinmanufacturingand50percentinservices,butrealwagesstagnated.Thatis,wagesmoveduplittleornotatall.So,wheredoesallthemoneygeneratedbytheincreasedproductivitygothen?Accordingtotheauthorsofthisbook,themoneygoestothesalariesforCEOs,tot
60、hestockmarket,andtocorporateprofits.Workersplayagreatroleinincreasingproductivity,butnolongerseetheirwagesconnectedtoincreasedproductivity.Inotherwords,CEOssalaries,thestockmarket,andthecorporateprofitsgoupasworkproductivitygoesup,butworkerswagesdont.WhatarethereasonswhyU.S.workers,whoarethemostprod
61、uctiveintheworld,havetoworklongerhours,havefewervacationdays,andseetheirwagesstagnateandnotrisingatthesamerateasproductivity?Theanswertothisquestioniscomplexandcontroversial,buttherearetworeasonsmostpeoplewhospeakorwriteabouttheseissuesmention:ThefirstisthatlaborunionsintheUnitedStateshavelostgreatp
62、owersincethebeginningofthe1980s,andthesecondisthatthegovernmenthaspassedlawsthatfavortherichandweakentherightsoftheworkers.Iseeourtimeisup.So,Illseeyounexttime.Chapter 4 FamilyintheUnitedStatesAhundredyearsago,oneheardthesamekindofcommentsabouttheAmericanfamilythatonehearstoday-inshort,thattheAmeric
63、anfamilyisdisintegrating.Proofofthisdisintegrationattheendofthenineteenthcenturyincludedthreepoints:thedecliningbirthrate,arisingdivorcerate,andevidencethatwomenwerenotcompletelycontentwiththeirdomesticrole.Itsalittlesurprisingtomethatthesameclaimaboutthefamilyisbeingmadetoday-thatitisdisintegrating
64、.Andoftenthesamepointsarementionedasproof:decliningbirthrates,increasingdivorcerates,anddiscontentofwomenwithdomesticroles.Now,innowaydoImeantoimplythatcultural,demographic,andeconomicconditionsarethesamenowastheywere100yearsago.Onthecontrary,theverynatureofthefamilyhaschangeddrasticallyinthelast50y
65、ears,nottomentionthelast100years.ButIdontthinktheaveragepersonsconceptofthefamilyhaschangedverymuchovertheyears.Alotofpeoplehaveonfixedideaofthefamily:amarriedcouplewhereMotherstayshometocareforthechildrenandFatherworks.ButthisideaischallengedbywhatweseeeverydayinU.S.society.Tobesure,thefamilyisaver
66、ysensitivebarometerforwhatishappeninginthesociety,theculture,andtheeconomyoftheUnitedStates.Tomakethispointclearer,welltakealookathowtheAmericanfamilyhaschangedinthelast50yearsbylookingatthreedifferenttimeperiods:therearethemid-1940stothemid-1960s;themid-60stothemid-80s;andfinallythepresent.SociologistB
- 温馨提示:
1: 本站所有资源如无特殊说明,都需要本地电脑安装OFFICE2007和PDF阅读器。图纸软件为CAD,CAXA,PROE,UG,SolidWorks等.压缩文件请下载最新的WinRAR软件解压。
2: 本站的文档不包含任何第三方提供的附件图纸等,如果需要附件,请联系上传者。文件的所有权益归上传用户所有。
3.本站RAR压缩包中若带图纸,网页内容里面会有图纸预览,若没有图纸预览就没有图纸。
4. 未经权益所有人同意不得将文件中的内容挪作商业或盈利用途。
5. 装配图网仅提供信息存储空间,仅对用户上传内容的表现方式做保护处理,对用户上传分享的文档内容本身不做任何修改或编辑,并不能对任何下载内容负责。
6. 下载文件中如有侵权或不适当内容,请与我们联系,我们立即纠正。
7. 本站不保证下载资源的准确性、安全性和完整性, 同时也不承担用户因使用这些下载资源对自己和他人造成任何形式的伤害或损失。
