 BHPBILLITONLTD(BHP.AX)1102

《BHPBILLITONLTD(BHP.AX)1102》由会员分享,可在线阅读,更多相关《BHPBILLITONLTD(BHP.AX)1102(17页珍藏版)》请在装配图网上搜索。
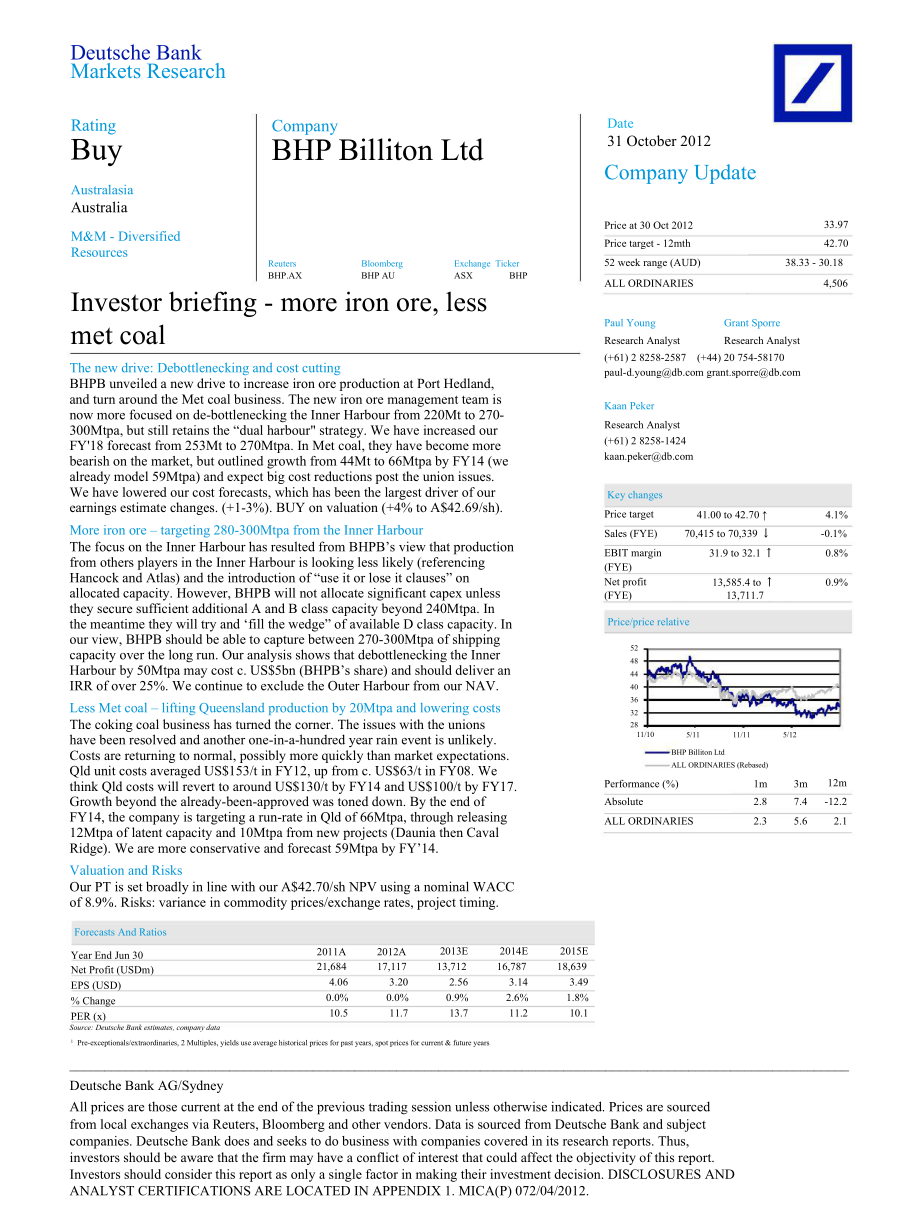
1、5248444036321Deutsche BankMarkets ResearchRatingBuyAustralasiaAustraliaCompanyBHP Billiton LtdDate31 October 2012Company UpdateM&M - DiversifiedResourcesReutersBloombergExchange TickerPrice at 30 Oct 2012Price target - 12mth52 week range (AUD)33.9742.7038.33 - 30.18BHP.AXBHP AUASXBHPALL ORDINARI
2、ES4,506Investor briefing - more iron ore, lessmet coalPaul YoungResearch AnalystGrant SporreResearch AnalystThe new drive: Debottlenecking and cost cuttingBHPB unveiled a new drive to increase iron ore production at Port Hedland,and turn around the Met coal business. The new iron ore management team
3、 isnow more focused on de-bottlenecking the Inner Harbour from 220Mt to 270-300Mtpa, but still retains the “dual harbour strategy. We have increased ourFY18 forecast from 253Mt to 270Mtpa. In Met coal, they have become morebearish on the market, but outlined growth from 44Mt to 66Mtpa by FY14 (wealr
4、eady model 59Mtpa) and expect big cost reductions post the union issues.(+61) 2 8258-2587 (+44) 20 754-58170paul- Kaan PekerResearch Analyst(+61) 2 8258-We have lowered our cost forecasts, which has been the largest driver of ourearnings estimate changes. (+1-3%). BUY on valuation (+4% to A$42.69/sh
5、).More iron ore targeting 280-300Mtpa from the Inner HarbourThe focus on the Inner Harbour has resulted from BHPBs view that productionfrom others players in the Inner Harbour is looking less likely (referencingHancock and Atlas) and the introduction of “use it or lose it clauses” onallocated capaci
6、ty. However, BHPB will not allocate significant capex unlessKey changesPrice targetSales (FYE)EBIT margin(FYE)Net profit(FYE)41.00 to 42.70 70,415 to 70,339 31.9 to 32.1 13,585.4 to 13,711.74.1%-0.1%0.8%0.9%they secure sufficient additional A and B class capacity beyond 240Mtpa. Inthe meantime they
7、will try and fill the wedge” of available D class capacity. Inour view, BHPB should be able to capture between 270-300Mtpa of shippingcapacity over the long run. Our analysis shows that debottlenecking the InnerHarbour by 50Mtpa may cost c. US$5bn (BHPBs share) and should deliver anIRR of over 25%.
8、We continue to exclude the Outer Harbour from our NAV.Less Met coal lifting Queensland production by 20Mtpa and lowering costsPrice/price relativeThe coking coal business has turned the corner. The issues with the unionshave been resolved and another one-in-a-hundred year rain event is unlikely.2811
9、/105/1111/115/12Costs are returning to normal, possibly more quickly than market expectations.Qld unit costs averaged US$153/t in FY12, up from c. US$63/t in FY08. WeBHP Billiton LtdALL ORDINARIES (Rebased)think Qld costs will revert to around US$130/t by FY14 and US$100/t by FY17.Growth beyond the
10、already-been-approved was toned down. By the end ofFY14, the company is targeting a run-rate in Qld of 66Mtpa, through releasing12Mtpa of latent capacity and 10Mtpa from new projects (Daunia then CavalPerformance (%)AbsoluteALL ORDINARIES1m2.82.33m7.45.612m-12.22.1Ridge). We are more conservative an
11、d forecast 59Mtpa by FY14.Valuation and RisksOur PT is set broadly in line with our A$42.70/sh NPV using a nominal WACCof 8.9%. Risks: variance in commodity prices/exchange rates, project timing.Forecasts And RatiosYear End Jun 30Net Profit (USDm)EPS (USD)% ChangePER (x)2011A21,6844.060.0%10.52012A1
12、7,1173.200.0%11.72013E13,7122.560.9%13.72014E16,7873.142.6%11.22015E18,6393.491.8%10.1Source: Deutsche Bank estimates, company dataPre-exceptionals/extraordinaries, 2 Multiples, yields use average historical prices for past years, spot prices for current & future years_Deutsche Bank AG/SydneyAll
13、 prices are those current at the end of the previous trading session unless otherwise indicated. Prices are sourcedfrom local exchanges via Reuters, Bloomberg and other vendors. Data is sourced from Deutsche Bank and subjectcompanies. Deutsche Bank does and seeks to do business with companies covere
14、d in its research reports. Thus,investors should be aware that the firm may have a conflict of interest that could affect the objectivity of this report.Investors should consider this report as only a single factor in making their investment decision. DISCLOSURES ANDANALYST CERTIFICATIONS ARE LOCATE
15、D IN APPENDIX 1. MICA(P) 072/04/2012.403631 October 2012M&M - Diversified ResourcesBHP Billiton LtdModel updated:30 October 2012Fiscal year end 30-Jun2010201120122013E2014E2015ERunning the numbersFinancial SummaryAustralasiaAustraliaM&M - Diversified ResourcesBHP Billiton LtdDB EPS (USD)Repo
16、rted EPS (USD)DPS (USD)BVPS (USD)Valuation MetricsPrice/Sales (x)2.232.270.878.723.74.064.421.0110.673.13.202.881.1212.382.82.562.561.1514.382.73.143.141.1915.662.43.493.491.2317.452.2Reuters: BHP.AXBuyPrice (30 Oct 12)Target Price52 Week rangeMarket Cap (m)Bloomberg: BHP AUAUD 33.97AUD 42.70AUD 30.
17、18 - 38.33AUDm 180,758P/E (DB) (x)P/E (Reported) (x)P/BV (x)FCF yield (%)Dividend yield (%)EV/SalesEV/EBITDAEV/EBIT15.615.33.84.52.53.88.110.110.59.64.18.92.43.26.88.011.713.02.64.13.03.06.68.213.713.72.42.13.33.07.19.411.211.22.23.33.42.76.17.910.110.12.04.53.52.65.67.1USDm 186,676Income Statement
18、(USDm)Company ProfileBHP Billiton Limited is an international resourcescompany. The companys principal business lines aremineral and petroleum production, including coal (thermaland coking), iron ore, aluminium, manganese, nickel,copper concentrate and cathode, diamonds, and oil & gas(convention
19、al and unconventional, LNG).Price Performance524844SalesEBITDAEBITPre-tax profitNet incomeCash Flow (USDm)Cash flow from operationsNet CapexFree cash flowEquity raised/(bought back)Dividends paidNet inc/(dec) in borrowingsOther investing/financing cash flowsNet cash flowChange in working capital52,7
20、9824,51319,71919,57212,72217,920-9,1918,72912-4,895-588-3021,5982,11571,73934,12329,01031,25523,64831,061-11,06719,994-9,828-5,144-799-5,355-2,402-46172,22632,68826,18023,02215,41726,382-18,2268,156-62-5,9339,007-14,019-4,7477670,33929,97922,60721,64313,71222,676-18,7743,9020-6,1184,000941329-69779,
21、15235,64127,34526,27416,78724,007-17,9166,0910-6,3262,200-1,7011403,50683,50339,01330,71029,53518,63927,464-19,1208,3450-6,5212,50002,7371,714Balance Sheet (USDm)3228Nov 10Feb 11May 11Aug 11Nov 11Feb 12May 12Aug 12Cash and cash equivalentsProperty, plant & equipmentGoodwill12,45655,57641410,0846
22、8,4685444,78195,2473,0786,051108,6703,4764,491119,9813,8057,228130,7994,092BHP Billiton LtdMargin Trends484440ALL ORDINARIES (Rebased)Other assetsTotal assetsDebtOther liabilitiesTotal liabilitiesTotal shareholders equityNet debt20,40688,85215,76423,75939,52349,3293,30823,795102,89115,90729,22945,13
23、657,7555,82326,167129,27328,33033,85862,18867,08523,54926,016144,21232,33034,07066,40077,81226,27928,224156,50134,53037,24171,77184,73130,03929,371171,49037,03040,12977,15994,33129,80236322810111213E14E15EKey Company MetricsSales growth (%)DB EPS growth (%)5.216.435.982.00.7-21.1-2.6-19.912.522.45.5
24、11.0EBITDA MarginGrowth & Profitability403020EBIT Margin504030Payout ratio (%)EBITDA Margin (%)EBIT Margin (%)ROE (%)Net debt/equity (%)Net interest cover (x)38.146.437.328.26.743.022.747.640.441.210.151.738.745.336.227.935.135.944.642.632.119.333.823.437.745.034.521.035.525.535.046.736.821.231.
25、626.11002010DuPont Analysis-100EBIT margin (%)37.340.436.232.134.536.810111213E14E15Ex Asset turnover (x)0.60.70.60.50.50.5x Financial cost ratio (x)1.01.01.01.01.01.0Solvency40302010Sales growth (LHS)ROE (RHS)605040302010 x Tax and other effects (x)= ROA (post tax) (%)x Financial leverage (x)= ROE
26、(%)annual growth (%)x NTA/share (avg) (x)= Reported EPSannual growth (%)0.715.21.928.891.57.92.27116.60.824.71.844.956.29.84.4294.50.613.31.925.1-44.011.52.88-34.80.610.01.919.3-23.413.32.56-11.10.611.21.921.09.015.03.1422.40.611.41.921.20.716.53.4911.000Source: Company data, Deutsche Bank estimates
27、10111213E14E15ENet debt/equity (LHS)Paul Young+61 2 8258-2587Page 2Net interest cover (RHS)paul-Deutsche Bank AG/Sydney5%Stainless Steel3%3%Specialty0%-0% 9%-2%4%31 October 2012M&M - Diversified ResourcesBHP Billiton LtdBHP BILLITON OPERATIONAL AND FINANCIAL SUMMARY DATAFX /COMMODITIES (Nom inal
28、)AUDUSDGold (US$/oz)Oil - WTI (US$/bbl)Copper (US$/lb)Aluminium (US$/lb)Nickel (US$/lb)Iron ore - lump (US$/t) - FOBIron ore - fines (US$/t) - FOBIron ore - fines (US$/t) - CIFCoking coal (US$/t)Steaming coal (US$/t)US natural gas (US$/mmBtu)Potash (US$/t)FY11A0.991,373903.941.0810.88168.8153.8161.8
29、251.3106.04.20433FY12A1.031,673953.700.998.76152.2140.3148.3261.3126.33.08438FY13F1.031,887993.630.948.14119.8107.8115.8183.8110.53.33475FY14F1.002,1001043.490.988.73119.0107.0115.0197.598.84.03500FY15F0.961,8781003.321.028.96119.0107.0115.0193.8102.64.50450FY16F0.911,6341033.151.058.73109.097.0105.
30、0181.397.14.75450FY17F0.861,3911052.981.088.5199.087.095.0168.891.64.75450FY18F0.821,3301083.281.309.60103.289.397.3181.299.94.87461FY19F0.801,3631103.371.339.84105.891.599.5185.7102.44.99473FY20F0.801,3971133.451.3610.09108.493.8101.8190.4104.95.12485NP V (HJ13)AluminiumBase MetalsDiamonds & Po
31、tashEnergy CoalIron oreManganeseMet CoalPetroleum - Shale gasPetroleum - ConventionalStainless Steel MaterialsGroup & UnallocatedInvestments and otherLess Net debtUS $M59863496075047352834162680975120474376445389-71372000-26596US $/sh1.126.571.411.3815.680.501.833.857.071.01-1.340.38-5.00AU$/sh1
32、.367.921.701.6618.890.612.214.648.521.22-1.620.45-4.87T OT AL183,42234.4742.69KEY FINANCIAL MET RICSUnder lying Ear nings (US $M)21,68417,11713,71216,78718,63918,07216,81720,71821,89921,845W ACC (nom inal)8.9%S har es5,321.1MOperating Cash Flow (US$M)Capex (incl. exploration) and divestments (US$M)D
33、ividend (US$M)Acquisitions (US$M)Fr ee Cash Flow (US $M) - befor e debt & equityNet Debt (US$M)Gear ing (ND/E - %)ROE (%)ROA (%)EPS (USc)DPS (USc)31,061(12,400)(5,144)(5,045)8,4725,82310.1%41.2%33.8%44210126,382(20,741)(5,933)(12,897)(13,189)23,54935.1%27.9%23.5%28811222,676(20,229)(6,118)-(3,67
34、1)26,27933.8%19.3%17.3%25611524,007(19,741)(6,326)-(2,060)30,03935.5%21.0%18.7%31411927,464(20,706)(6,521)-23729,80231.6%21.2%19.6%34912329,196(20,760)(6,714)-1,72328,07926.8%18.4%17.7%33812629,091(19,328)(6,917)-2,84625,23322.1%15.6%15.8%31513030,664(18,615)(7,105)-4,94420,28916.3%17.6%18.1%3881343
35、4,328(16,487)(7,312)-10,5289,7617.1%17.0%18.7%41013835,556(15,082)(7,532)-12,943(3,182)-2.1%15.5%18.5%409142Payout ratio (%)25%35%45%38%35%37%41%35%34%35%V aluation (HJ2013)P RODUCT IONCopper (kt)Iron ore (Mt) - AttributableIron ore (Mt) - Pilbara (100%)Petroleum (Mmboe) - Shale gasPetroleum (Mmboe)
36、 - ConventionalPetroleum (Mmboe) - TotalCoal - Hard coking (Mt)Coal - Thermal (Mt)Aluminium (kt)Diamonds (kcts)Nickel (kt)Manganese ore (kt)1,13942144615315933701,2462,5061537,0111,094451748613722233711,1531,7841587,8791,177461839914224136771,1961,8751668,1941,3415021214015129139771,2622,1871608,584
37、1,42821123116914231241791,2411,7981607,9501,41822724919213432642801,2641,8041607,9501,39023826222912635542801,2651,8011607,9501,49324527024912737642811,2771,8021607,9501,50724527026512839342821,2841,8011607,9501,50724527027112839942821,2841,8011607,950Petroleum -Shale gas10%M et CoalManganese1%Iron
38、ore39%Petroleum -Conventional17%Stainless SteelMaterials3%Aluminium3%Base Metals16%Diamonds &Potash3%Energy Coal3%Manganese alloys (kt)Potash (Mt)774-688-514-534-540-548-5441.05462.05453.05454.0Revenue split (2013F)REV ENUE (US $M)Petroleum - Shale gasPetroleum - Conventional10710,6302,16910,768
39、2,94712,0404,83713,5446,86112,9677,60013,2458,64013,5669,10814,8519,64715,5399,68516,080Iron ore26%Petroleum - TotalAluminiumBase MetalsIron ore10,7375,22114,15220,41212,9374,76611,59622,60114,9885,06213,76218,36418,3815,49514,86621,01019,8295,64614,73423,40020,8455,92913,82822,96922,2056,15212,7112
40、1,91323,9596,84014,44823,26625,1867,46014,89023,85225,7647,66114,66424,440Base M etals20%Met Coal9%Diam onds &Potash1%Met CoalManganeseDiamonds & PotashEnergy coal7,5732,4231,5175,5077,5762,1521,3266,0226,0382,4266046,1516,9782,6596255,7557,2502,3804626,2746,9852,3844646,1016,6672,3549135,84
41、17,1912,5281,3976,3197,3702,5891,9056,4937,5532,6542,4376,615Aluminium7%Manganese3%Energy coal9%Stainless Steel MaterialsGroup & Unallocated and IntersegmentT ot al3,861336717392,993257722263,026272706933,116306791903,205323835033,121321829463,046318821193,371347896673,455362935613,33436995491Pe
42、troleum -Conventional17%Petroleum -Shale gas4%Stainless SteelMaterials4%CAP EX (US $M)Gr owt hCapex split (2013F)Petroleum - Shale gasPetroleum - ConventionalPetroleum - Total1631,1781,3413,2931,8715,1645,0001,3086,3085,5008056,3056,6509107,5606,9259547,8796,7507907,5406,7504517,2015,9004176,3175,55
43、04235,973Diamonds & Potash Energy coalProductsMaterialsAluminiumBase MetalsCarbon Steel MaterialsDiamonds & Specialty ProductsPotashEnergy coalStainless Steel MaterialsOther (represents small projects)T ot al Growt hS ust ainingT ot al CapexExplorationT ot al capex incl. Explor ation1,093849
44、3,81174160451345938,2163,39411,6101,24012,8506371,8547,212197307585143(351)15,7484,48120,2302,39322,623501,4255,370-400400401,00014,9935,71120,7041,46622,170501,2503,685-8005040-12,1805,73617,9161,83619,752501,0002,000-3,000-13,6105,51019,1201,58620,706-1,2501,500-3,000-13,6295,54419,1731,58620,760-
45、1,0001,500-2,000-12,0405,70117,7411,58619,328-3001,236-2,377-11,1155,90617,0211,59418,615-1,242-1,218-8,7776,11214,8891,59816,487-1,249-7,2226,25613,4781,60415,0820%Carbon SteelMaterials39%Petroleum -Shale gas36%Petroleum -Base Metals AluminiumConventional10%EBIT split (2013F)EBIT (US $M)Petroleum -
46、 Shale gasPetroleum - Conventional3545,976-1406,488-1397,6731,2737,7083,6036,9264,7306,5845,6316,3376,1916,6396,2066,9115,8947,101Petroleum - TotalAluminiumBase MetalsCarbon Steel MaterialsDiamonds & Specialty ProductsEnergy coalStainless Steel MaterialsGroup & UnallocatedT ot alEBIT m ar gi
47、nsPetroleum - Shale gasPetroleum - ConventionalPetroleum - TotalAluminiumBase MetalsCarbon Steel MaterialsDiamonds & Specialty ProductsEnergy coalStainless Steel MaterialsT ot al63302666790166955871129588-4053198032%62%59%5%48%55%39%21%15%45%6348-291396516006199122732-31927167-6%60%49%-6%34%50%1
48、5%20%1%38%7534-23753499668101914-5-67322651-5%64%50%-5%39%36%17%15%0%32%8981-9464561194999503336-7152751524%59%49%-2%43%39%16%9%11%35%1052978603213732-40820436-8753071045%58%53%1%41%42%-9%13%14%37%11314175505513024-37664394-10192956950%58%54%3%37%40%-8%11%13%36%11968215393411604-105398347-1047273155
49、0%58%54%3%31%38%-11%7%11%33%12830342545713409264778778-10573280149%59%54%5%38%41%19%12%23%37%13117733595713985425866822-10833482246%59%52%10%40%41%22%13%24%37%12995805593614395846908655-11143542743%60%50%11%40%42%35%14%20%37%Base M etals21%Aluminium-1%Petroleum -Conventional31%Iron ore39%Met CoalDia
50、monds0%Manganese2%Energy coalPetroleum - SSMShale gas 0%-2%Source: Company data, DB estimatesDeutsche Bank AG/SydneyPage 31.2.3.4.31 October 2012M&M - Diversified ResourcesBHP Billiton LtdSweating the PilbaraTargeting 280-300Mtpa from the Inner HarbourBHPB laid out a more definitive growth plan
51、in iron ore which includes increasingproduction in the Inner Harbour beyond the companys 240Mtpa of allocated shippingcapacity, and then potentially pursuing the Outer Harbour if demand for iron oresupports this development. This comes after spending 5 years studying the 100MtpaOuter Harbour (this p
52、roject was included in future options since 2007, moved intofeasibility in 2011, but was halted in mid 2012), as the preferred growth option beyond240Mtpa in the Inner Harbour.The new iron ore management is now clearly focused on de-bottlenecking the InnerHarbour from 220Mt to 270-300Mtpa and beyond
53、, as a priority, but still retains the“dual harbor” strategy. Management stated that when the “risk weighted NPV” of theOuter Harbour exceeds that of the Inner Harbour they may proceed. They will “retain”this option going forward but now believe “they will never regret the de-bottleneckingstrategy”.
54、 Although there is an opportunity cost to not having started on a de-bottlenecking strategy earlier, we prefer this to potentially embarking on an expensivegrowth strategy.Four things have changed to make de-bottlenecking the Inner Harbour a more attractiveoption. These are;They were recently awarde
55、d the option to build two new berths at BurgessPoint (see Figure 2) by the Port Hedland Port Authority (PHPA).Production from others players in the Inner Harbour is looking less likely(referencing Hancock and Atlas)There is now a use it or lose clause between the PHPA and other players(and BHPB will
56、 wait for this to play out)Berths and allocation can now be reallocated to existing players by thePHPA (105Mtpa of A and B class is yet to be built)These changes have increased the probability of BHPB being awarded some additionalcapacity in the Inner Harbour. However, BHPB will not allocate signifi
57、cant capex unlessthey secure sufficient additional A and B class capacity beyond 240Mtpa (see Figure 3for capacity and class allocation by company). In the meantime they will try and fill thewedge” of available D class capacity, which is capacity that is left over after A and Bclass capacity has bee
58、n used. Plenty of D class capacity is available considering theInner Harbour is rated at 495Mtpa (but is potentially higher depending on shipmovements and ship size) as only c. 275Mtpa of capacity is currently being utilized. Inour view, BHPB should be able to capture between 270-300Mtpa of shipping
59、 capacityover the long run.Page 4Deutsche Bank AG/Sydney31 October 2012M&M - Diversified ResourcesBHP Billiton LtdFigure 1: Capacity allocation at Port Hedland BHPB hasan allocation of 240MtpaSource: PHPAFigure 3: Capacity and Class allocation at Port HedlandFigure 2: Berth configuration at Port
60、 Hedland BHPB isplanning for two new berths at Burgess PointSource: BHPBCompanyBHPBFortescueHancockClass A2009535Class B402520Class C000Class D000Total24012055ClassClass AClass BClass CDefinitionnon-tidal constrainedtidal constrainedno constraints (buttypically non iron-ore)AtlasBrockmanUtah PointOt
61、hesrTotal0000330321900135002010300000032192010495Class Dwhats left overSource: Deutsche Bank, PHPAThe de-bottlenecking processThe potential “harbor capacity capture” opportunity has led management to study thepossibility to increase capacity of existing infrastructure by indentifying the bottlenecks
62、at the conveyors and stacker/reclaimers between the car dumpers and shiploaders. Thestudy will take “several months”, the expansion and capital allocation will be doneincrementally and no “grand plan” will be taken to the board. BHPB has proven thattheir 5 car dumpers can unload up to 60Mtpa and 8 s
63、hiploaders c. 35Mtpa each (1needs to be upgraded), therefore the port handling infrastructure should in theory berated to 280-300Mtpa, if the transfer equipment is upgraded.Deutsche Bank AG/SydneyPage 531 October 2012M&M - Diversified ResourcesBHP Billiton LtdDirect loading of ships from the car
64、 dumpers (i.e. bypassing the stacker and reclaimersat the port) increased to 43% in FY12 and BHPB believes they can increase directloading to over 60%. This will reduce the need for excessive stockyard expansions.However the need to increase blending at the port as production expands might requireth
65、e early development of the Boodarie stockyard (located on the HBI site) before theOuter Harbour is developed.The rail system will be rated for well over 300Mtpa when double tracking is complete (itcreates a large rail loop removing the need for passing bays) and mine capacity isavailable. The expans
66、ion of Jimblebar to 35Mtpa will take mine capacity from 185Mt to220Mtpa (on a 100% basis) and can then be expanded to 55Mtpa and then furtheragain to 75Mtpa. This would take total mine capacity to 260Mtpa. Mobile crushers canlift capacity of the existing mines by 5Mtpa, at most, to fully utilise train load outsystems. The key to the mine expansions will be to optimise the Pilbara blend.Jimblebar is high in alumina but attracts no penalty as the current mills are penalizingseaborne iron ore with high silica (Chinese ore is high in silica). Pushing capacitybeyond 280Mtpa will require the
- 温馨提示:
1: 本站所有资源如无特殊说明,都需要本地电脑安装OFFICE2007和PDF阅读器。图纸软件为CAD,CAXA,PROE,UG,SolidWorks等.压缩文件请下载最新的WinRAR软件解压。
2: 本站的文档不包含任何第三方提供的附件图纸等,如果需要附件,请联系上传者。文件的所有权益归上传用户所有。
3.本站RAR压缩包中若带图纸,网页内容里面会有图纸预览,若没有图纸预览就没有图纸。
4. 未经权益所有人同意不得将文件中的内容挪作商业或盈利用途。
5. 装配图网仅提供信息存储空间,仅对用户上传内容的表现方式做保护处理,对用户上传分享的文档内容本身不做任何修改或编辑,并不能对任何下载内容负责。
6. 下载文件中如有侵权或不适当内容,请与我们联系,我们立即纠正。
7. 本站不保证下载资源的准确性、安全性和完整性, 同时也不承担用户因使用这些下载资源对自己和他人造成任何形式的伤害或损失。
