 ST雷伊B:第三季度报告全文(英文版)

《ST雷伊B:第三季度报告全文(英文版)》由会员分享,可在线阅读,更多相关《ST雷伊B:第三季度报告全文(英文版)(11页珍藏版)》请在装配图网上搜索。
1、to-Guangdong Rieys Group Company LtdThe Third Quarterly Report 20111 Important Notice1.1 The Board of Directors, the Supervisory Committee and directors, supervisors andsenior management of Guangdong Rieys Group Company Ltd. (hereinafter referred toas “the Company”) hereby guarantee that this report
2、 contains no false information,misleading statements or material omissions, and will, individually and collectively,accept responsibility for the factuality, accuracy and completeness of this report.1.2 The Financial Report in the third quarterly report has not been audited by a CPAfirm.1.3 Chen Hon
3、gcheng, person in charge of the Company, Chen Peixia, person incharge of the accounting work and person in charge of the accounting organ (chiefaccountant) hereby confirmed that the Financial Report enclosed in the quarterlyreport is true and complete.2 Company Profile2.1 Main accounting data and fi
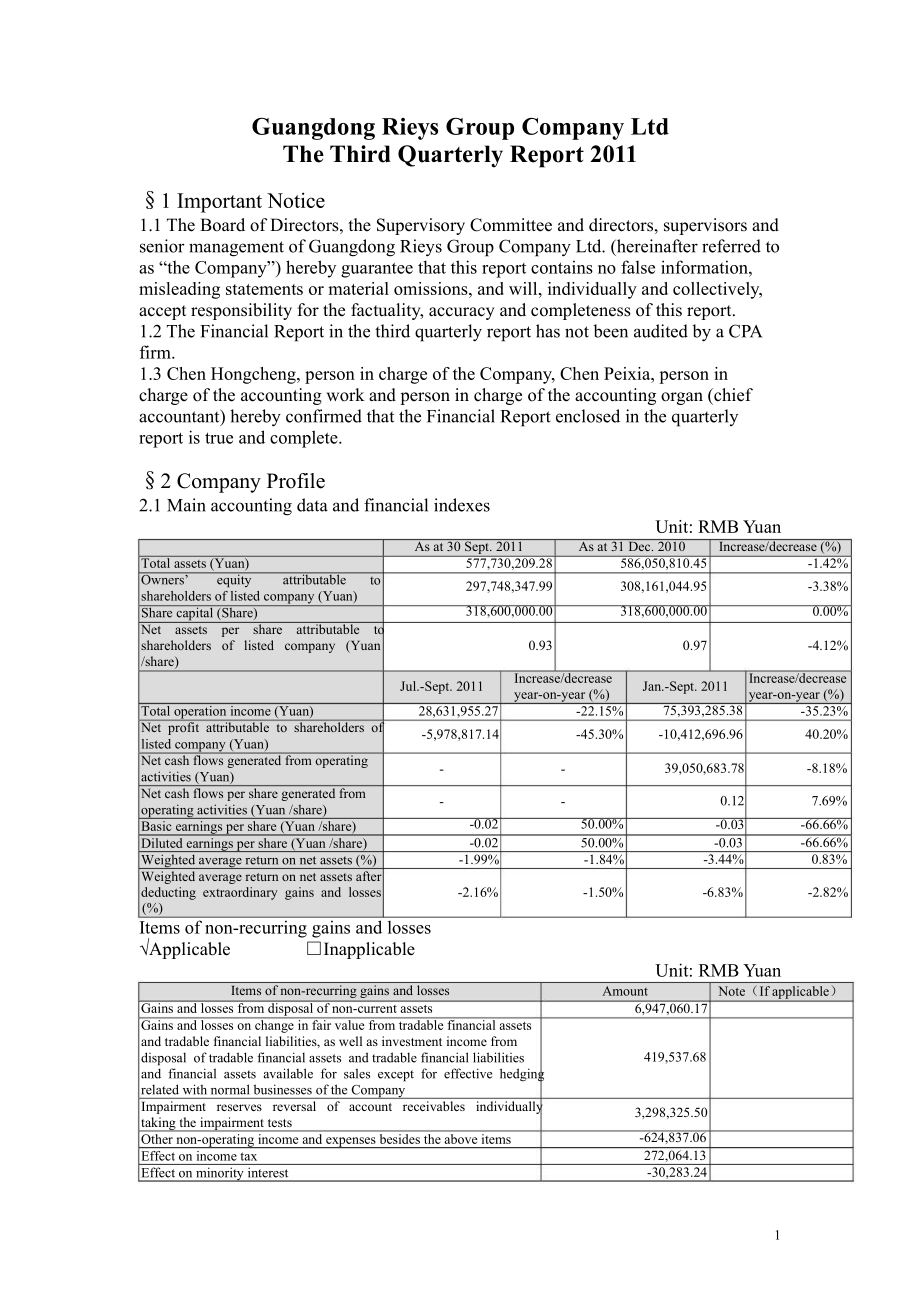
4、nancial indexesUnit: RMB YuanAs at 30 Sept. 2011As at 31 Dec. 2010Increase/decrease (%)Total assets (Yuan)Owners equity attributableshareholders of listed company (Yuan)Share capital (Share)577,730,209.28297,748,347.99318,600,000.00586,050,810.45308,161,044.95318,600,000.00-1.42%-3.38%0.00%Net asset
5、s per share attributable toshareholders of listed company (Yuan0.930.97-4.12%/share)Jul.-Sept. 2011Increase/decreaseyear-on-year (%)Jan.-Sept. 2011Increase/decreaseyear-on-year (%)Total operation income (Yuan)Net profit attributable to shareholders oflisted company (Yuan)Net cash flows generated fro
6、m operatingactivities (Yuan)Net cash flows per share generated fromoperating activities (Yuan /share)Basic earnings per share (Yuan /share)Diluted earnings per share (Yuan /share)Weighted average return on net assets (%)28,631,955.27-5,978,817.14-0.02-0.02-1.99%-22.15%-45.30%50.00%50.00%-1.84%75,393
7、,285.38-10,412,696.9639,050,683.780.12-0.03-0.03-3.44%-35.23%40.20%-8.18%7.69%-66.66%-66.66%0.83%Weighted average return on net assets afterdeducting extraordinary gains and losses-2.16%-1.50%-6.83%-2.82%(%)Items of non-recurring gains and lossesApplicableInapplicableUnit: RMB YuanItems of non-recur
8、ring gains and lossesGains and losses from disposal of non-current assetsGains and losses on change in fair value from tradable financial assetsand tradable financial liabilities, as well as investment income fromdisposal of tradable financial assets and tradable financial liabilitiesand financial a
9、ssets available for sales except for effective hedgingrelated with normal businesses of the CompanyImpairment reserves reversal of account receivables individuallytaking the impairment testsOther non-operating income and expenses besides the above itemsEffect on income taxEffect on minority interest
10、Amount6,947,060.17419,537.683,298,325.50-624,837.06272,064.13-30,283.24Note(If applicable)1-Total10,281,867.182.2 Total number of shareholders and shareholding of top ten shareholders holdingtradable sharesUnit: shareTotal number of shareholders at the period-endShareholding of top ten shareholders
11、holding tradable shares14,865Full name of shareholderNumber of tradable shares held atperiod-endType of shareSU YOU HEQIN YU YANZHENG SU XIANXU HAILUO DONG HUINGAI KWOK PAN (WEI GUO BIN)CHEN JIAN SHENGWANG YAN FENGWU CHI LIKE ZHONG FENG5,580,463 Domestically listed foreign shares1,995,033 Domestical
12、ly listed foreign shares1,721,118 Domestically listed foreign shares1,493,101 Domestically listed foreign shares1,441,200 Domestically listed foreign shares1,145,816 Domestically listed foreign shares1,017,797 Domestically listed foreign shares1,011,753 Domestically listed foreign shares808,800 Dome
13、stically listed foreign shares789,800 Domestically listed foreign shares3 Significant Events3.1 Particular about large-margin change of main accounting statement item andfinancial index and its reasonApplicableInapplicableExplanations on items with an over-30% movement:Unit: RMB YuanItems in the bal
14、ancesheetMonetary fundsAccounts receivable30 Sept. 20116,621,98529,882,29631 Dec. 201030,095,39860,384,108Movement (%)-78.00-50.51ExplanationRepayment of loans to China ConstructionBankReceivables from Rieys Paper werecollected.Prepayment for the construction of realPrepayments99,849,74069,492,60543
15、.68estate development projects launched byHengda Real EstateShort-termborrowingsOther payablesOperating revenuesOperating costsOperating expenses93,999,96089,010,42975,393,285.3859,292,969.884,968,826.02158,500,00034,590,357116,408,282.0786,610,473.319,780,506.27-40.69157.33-35.23-31.54-49.20Loans g
16、ranted by China ConstructionBank were repaid.A borrowing of RMB 63.70 million froma related partyLess exportLess exportLess export3.2 Progress and influence of significant events, as well as the analysis on solutions3.2.1 Non-standard audit opinionApplicableInapplicableAsia (Group) Accounting Firm i
17、ssued an unqualified audit report with pinpointedmatters for the 2010 Annual Financial Report of the Company. The said pinpointedmatters were stated as, “We warn the users of financial statements to pay attention tothe content of Notes to the Financial Statements X (10), which is in the year 2010, n
18、etprofit attributable to owners of the parent company stood at RMB -41,187,000 and atRMB -42,204,000 after deducting non-recurring gains and losses. In 2010, the mainbusiness scope of the Company was transformed from garments to both garments andreal estate development. The real estate projects have
19、 been started but not pre-sold,there still existed uncertainty whether the real estate business would generate a profitor not. The Company had disclosed in detail improvement measures to be taken in thenotes to the financial statements, but there still existed a significant uncertainty aboutthe goin
20、g-concern ability of the Company. The statements above will not affect the2unqualified audit opinion that has been issued.”The Board of Directors is of the opinion that the biggest obstacle to the Companysdevelopment has been removed through the asset exchange at the end of 2009, whichgreatly improv
21、es its asset quality. Although the Company is still in loss in thereporting period, a loss reduction about RMB 4.20 million has been achieved ascompared with the loss about RMB 14.61 million in the same period of last year. As isshown, the loss is decreasing. The real estate projects in Puning curre
22、ntly developedby the Company are on smooth progress with about RMB 40 million being input inthe projects accumulatively during the first half year of 2011, thus the construction ofthe projects can be implemented as schedule basically. Meanwhile, the target ofnational macro control on real estate ind
23、icates that the demands in real estate marketare large in cities like Puning. To sum up, the Companys business is beginning to turnin a positive direction and its continual operation ability is fully guaranteed.3.2.2 Whether the Company provided funds to the controlling shareholder or itsrelated par
24、ties or provided guarantees to external parties in violation of the prescribedproceduresApplicable Inapplicable3.2.3 Signing and execution of significant contracts concerning routine operationsApplicable Inapplicable3.2.4 OthersApplicable Inapplicable3.3 Fulfillment of commitments made by the Compan
25、y, shareholders and the actualcontrollerCommitments made by the Company, its directors, supervisors, senior executives,shareholders with an over 5% shareholding, actual controller and other stakeholdersduring the reporting period, or such commitments carried down into the reportingperiod:Applicable
26、Inapplicable3.4 Warnings of possible losses or major changes of the accumulative net profitachieved during the period from year-begin to the end of the next reporting periodcompared with the same period of last year, as well as explanation on reasonsApplicable InapplicablePerformance forecastDeficit
27、From year-begin to the end ofthe next reporting periodSame period of last yearIncrease/decrease(%)Estimated accumulative netprofit (RMB0000)Basic earnings per share(Yuan/share)-1,700.00-0.05-4,219.00 Decrease-0.13 Decrease-59.70%-61.53%Currently, the main business scope of the Company is garments pr
28、oduction and real estatedevelopment, the reasons of the loss reduction in the net profit incurred in the period fromthe year-begin to the end of the next reporting period are as follows: (1) Real estateprojects developed by the Company are still in the development phase and they could notNotes to pe
29、rformance forecast be completed and settled within the year 2011, and the profits of garments production cantturn the Company to be profit; (2) Investment income was gained from the sales ofShenzhen Missk Fashion Co., Ltd. during the reporting period; (3) The debtsreorganization with China Construct
30、ion Bank hasnt been finished, so the deducted interestcant be recorded into current gains and losses temporarily.3.5 Other significant events that need to be explained3.5.1 Investments into securitiesApplicable InapplicableUnit: RMB YuanSerial Securities varietyStock codeShort formInitialShares held
31、 at Book value at Proportion inGains or31-ItemsNo.of stockinvestmentperiod-endperiod-endtotallosses inamount(share)securitiesthe(Yuan)investment at reporting*ST Chinaperiod-end(%)periodStock000607Union20,239.003,70017,353.00100.00%-2,886.00HoldingsOther securities investments held at period-end0.000
32、.000.00%0.00Gains/ losses from securities investment sold in thereporting periodTotal-20,239.00-17,353.00-422,423.68100% 419,537.68Explanations for particulars about securities investment: With purpose of promotingthe use efficiency of idle capital, securities investment of the Company is inaccordan
33、ce with management authorities, all procedure, and internal control rules aswell as decision approval of conducting securities investment. While securitiesinvestment of the Company is of a small amount, low profitability that has a littleimpact on business performance of the reporting period.3.5.2 R
34、eception of research, interviews and visits in the reporting periodTimePlaceWay of receptionVisitorMain discussion and materials providedby the CompanyInquiring about the progress of the27 Jul. 201125 Aug. 201130 Aug. 20118 Sept. 201119 Sept. 2011Office of the Board Communication by telephone Invest
35、orOffice of the Board Communication by telephone InvestorOffice of the Board Communication by telephone InvestorOffice of the Board Communication by telephone InvestorOffice of the Board Communication by telephone InvestorCompanys real estate development andthe status on debt repayment for ChinaCons
36、truction BankInquiring about the Companys basicsituation and the progress of its realestate developmentInquiring about the Companys overalloperation situation and the progress of itsreal estate developmentInquiring about the progress of theCompanys real estate development andthe status of debt for C
37、hina ConstructionBankInquiring about the progress of theCompanys real estate developmentprojects and the situation of thesubsequent projects3.6 Investments into derivativesApplicable Inapplicable3.6.1 Positions of derivatives investments held at the period-endApplicable Inapplicable 4 Appendix4.1 Ba
38、lance sheetPrepared by Guangdong Rieys Group Company Ltd 30 Sept. 2011Unit: RMB (Yuan)Current assets:Balance as at 30 Sept. 2011Consolidation The CompanyBalance as at 31 Dec. 2010Consolidation The CompanyMonetary funds6,621,984.571,282,203.2130,095,398.0628,150,078.47Settlement fundsOutgoing call lo
39、ansTransaction financial assetNotes receivableAccount receivable17,353.0029,882,296.1117,353.0060,384,107.71Prepayment99,849,740.14968,244.0069,492,604.59338,244.00Insurance premium receivables4ReinsuranceaccountsreceivableReinsurance contract reservereceivablesInterest receivableDividend receivable
40、Other accounts receivable22,463,216.63137,899,881.4027,781,691.68106,997,618.63Financial assets purchasedunder agreements to resellInventories239,488,367.57205,006,377.50Non-current assets due within 1yearOther current assets5,000,000.005,000,000.00Total current assets398,322,958.02140,167,681.61397
41、,760,179.54140,485,941.10Non-current assets:Loan and payment on othersbehalf disbursedAvailable-for-salefinancialassetsHeld to maturity investmentsLong-term account receivableLong-term equity investmentInvestment property243,312,508.68243,312,509.68Fixed asset105,465,570.2499,602,812.16110,872,936.6
42、8103,288,925.43Project in processEngineering material54,526.0054,526.0054,526.0054,526.00Fixed asset disposalProduction biological assetOil-gas assetsIntangible assets65,313,522.2765,313,522.2766,441,172.0566,441,172.05Development expenseGoodwillLong-term deferred expenseDeferred tax assetsOther non
43、-current assetsTotal non-current assetsTotal assets7,753,552.75820,080.00179,407,251.26577,730,209.282,311,644.02410,595,013.13550,762,694.7410,056,556.18865,440.00188,290,630.91586,050,810.455,048,816.11418,145,949.27558,631,890.37Current liabilities:Short-term borrowings93,999,960.0078,999,960.001
44、58,500,000.00143,500,000.00Borrowing from central BankDeposits received and held forothersCall loan receivedTransaction financial liabilitiesNotes payableAccount payableAccount received in advance5,743,109.31125,104.2419,442.645,208,298.0639,821.2419,442.64Financial assets sold underagreements to re
45、purchaseHandling charges andcommission payablePayroll payableTaxes payableInterest payable1,100,933.693,673,138.0181,801,155.36174,894.93635,239.6973,929,683.661,316,693.316,660,913.3467,636,166.85163,554.901,460,207.1561,952,339.22Dividend payableOther payables89,010,429.35191,637,839.6134,590,357.
46、22122,403,842.79Account due to reinsuranceInsurance contract reserveEntrusted trading of securitiesEntrusted selling of securitiesNon-current liabilities duewithin 1 yearOther current liabilities99,671.66Total current liabilities275,453,829.96345,397,060.53274,051,921.68329,499,386.705ItemsNon-curre
47、nt liabilities:Long-term borrowingsBonds payableLong-term payablesSpecific payablesEstimated liabilitiesDeferred taxes liabilitiesOther non-current liabilitiesTotal non-current liabilitiesTotal liabilities275,453,829.96345,397,060.53274,051,921.68329,499,386.70Owners equity (or shareholdersequity):P
48、aid-in capital (or share capital)Capital reserve318,600,000.0052,129,496.58318,600,000.0052,129,496.58318,600,000.0052,129,496.58318,600,000.0052,129,496.58Less:treasury stockSpecific reservesSurplus reserves86,036,260.2086,036,260.2086,036,260.2086,036,260.20General risk provisionRetained earnings-
49、159,017,408.79-251,400,122.57-148,604,711.83-227,633,253.11Foreign exchange differenceTotal equity attributable to ownersof the CompanyMinority interestTotal owners equityTotal liabilities and ownersequity297,748,347.994,528,031.33302,276,379.32577,730,209.28205,365,634.21205,365,634.21550,762,694.7
50、4308,161,044.953,837,843.82311,998,888.77586,050,810.45229,132,503.67229,132,503.67558,631,890.374.2 Income statement for Jul.-Sept. 2011Prepared by Guangdong Rieys Group Company LtdJul.-Sept. 2011Unit: RMB (Yuan)Jul.- Sept. 2011Consolidation The CompanyJul.- Sept. 2010Consolidation The CompanyI. To
51、tal salesIncluding: Sales28,631,955.2728,631,955.27417,000.00417,000.0036,779,725.0336,779,725.03417,000.00417,000.00Interests incomePremium incomeHandlingchargesandcommission incomeII. Total cost of salesIncluding: Cost of sales34,214,917.0821,616,352.979,113,638.60400,263.9939,280,127.7128,907,253
52、.378,671,557.76400,263.99Interests expensesHandlingchargesandcommission incomeInsurance discharge paymentClaim expenses-netProvision for insurance contractreserves-netInsurance policy dividend paidReinsurance expenseBusiness taxes and surcharges30,231.42Distribution expenses606,491.123,242,078.9696.
53、00Administrative expenses4,304,286.972,290,430.396,186,898.923,832,223.806ItemsFinancial costs7,788,524.556,422,944.226,190,251.264,438,973.97Impairment lossAdd: gain/(loss) from change infair value (“-” means loss)Investment income (“-” meansloss)-100,738.5389,761.52313,876.6258,977.0050,722.60-5,2
54、76,586.22Including:incomefrominvestment on affiliated enterpriseand jointly enterpriseForeign exchange difference(“-” means loss)III. Operating profit (“-” meansloss)Add: non-business incomeLess: non-business expense-5,179,323.677,310.23-52,474.08-8,586,939.00100.00-2,500,402.680.80189,644.72-8,254,
55、557.76115,610.52Including: loss fromnon-current asset disposalIV. Total profit (“-” means loss)Less: tax expenseV. Net profit (“-” means loss)Attributable to equity holders ofthe CompanyMinority interests-5,119,539.36849,066.46-5,968,605.82-5,978,817.1410,211.32-8,587,039.0014,744.25-8,601,783.25-8,
56、601,783.250.00-2,690,046.60793,996.87-3,484,043.47-3,266,996.73-217,046.74-8,370,168.280.00-8,370,168.28-8,370,168.280.00VI. Earnings per share(I) Basic earnings per share(II) Diluted earnings per share. Other composite income. Total composite incomeAttributable to owners of theCompanyAttributable t
57、o minorityshareholders-0.02-0.020.00-5,968,605.82-5,978,817.1410,211.32-0.03-0.030.00-8,601,783.25-8,601,783.250.00-0.01-0.010.00-3,484,043.47-3,266,996.73-217,046.74-0.03-0.030.00-8,370,168.28-8,370,168.280.00Where there were business combinations under the same control in this reportingperiod, the
58、 combined parties achieved net profit of RMB 0.00 before thecombinations.4.3 Income statement for Jan.-Sept. 2011Prepared by Guangdong Rieys Group Company LtdJan.-Sept. 2011Unit: RMB (Yuan)Jan.-Sept. 2011Consolidation The CompanyJan.-Sept. 2010Consolidation The CompanyI. Total salesIncluding: Sales7
59、5,393,285.3875,393,285.381,277,000.001,277,000.00116,408,282.07116,408,282.079,240,130.709,240,130.70Interests incomePremium incomeHandlingchargesandcommission incomeII. Total cost of salesIncluding: Cost of sales90,500,339.8559,292,969.8821,771,759.371,200,791.97125,518,717.5286,610,473.3135,231,77
60、5.719,461,885.257Interests expensesHandling charges andcommission incomeInsurance discharge paymentClaim expenses-netProvision for insurance contractreserves-netInsurance policy dividend paidReinsurance expenseBusiness taxes and surcharges51,215.2188,281.17Distribution expensesAdministrative expense
61、sFinancial costsImpairment lossAdd: gain/(loss) on change infair value (“-” means loss)Gain/(loss) on investment (“-”means loss)Including:incomefrom4,968,826.0216,267,416.3417,204,957.22-7,285,044.82-2,886.008,482,728.1780,000.007,582,797.9913,186,661.70-278,492.29-2,886.00120,369.729,780,506.2719,7
62、17,157.1819,415,451.62-10,093,152.030.0086,207.2810,805,661.6915,465,119.06-587,097.57investment on associate andjointly-run venturesGain or loss on foreignexchange difference (“-” meansloss)III. Operating profit (“-” meansloss)Add: non-business incomeLess: non-business expense-6,627,212.3079,979.69
63、1,818,061.07-20,377,275.6520,195.45672,617.17-9,110,435.4558,913.191,000,944.65-25,991,645.0116,218.01897,005.92Including: loss from disposal ofnon-current assetsIV. Total profit (“-” means loss)Less: tax expense-8,365,293.682,593,366.67-21,029,697.372,737,172.09-10,052,466.915,154,292.44-26,872,432
64、.92146,774.39V. Net profit(“-” means loss)-10,958,660.35-23,766,869.46-15,206,759.35-27,019,207.31Attributable to equity holdersof the CompanyMinority interests-10,412,696.96-545,963.39-23,766,869.460.00-14,606,499.51-600,259.84-27,019,207.310.00VI. Earnings per share(I) Basic earnings per share(II)
65、 Diluted earnings per share. Other composite income. Total composite incomeAttributable to owners of theCompanyAttributable to minorityshareholders-0.03-0.030.00-10,958,660.35-10,412,696.96-545,963.39-0.07-0.070.00-23,766,869.46-23,766,869.460.00-0.05-0.050.00-15,206,759.35-14,606,499.51-600,259.84-
66、0.08-0.080.00-27,019,207.31-27,019,207.310.00Where there were business combinations under the same control from the year-beginto the period-end, the combined parties achieved net profit of RMB 0.00 before thecombinations.8Items4.4 Cash flow statement for Jan.-Sept. 2011Prepared by Guangdong Rieys Group Company LtdJan.-Sept. 2011Unit: RMB (Yuan)1. Cash flows from operatingactivities:Jan.- Sept. 2011Consolidation The CompanyJan.-Sept. 2010Consolidation The CompanyCash received from sales ofgoods o
- 温馨提示:
1: 本站所有资源如无特殊说明,都需要本地电脑安装OFFICE2007和PDF阅读器。图纸软件为CAD,CAXA,PROE,UG,SolidWorks等.压缩文件请下载最新的WinRAR软件解压。
2: 本站的文档不包含任何第三方提供的附件图纸等,如果需要附件,请联系上传者。文件的所有权益归上传用户所有。
3.本站RAR压缩包中若带图纸,网页内容里面会有图纸预览,若没有图纸预览就没有图纸。
4. 未经权益所有人同意不得将文件中的内容挪作商业或盈利用途。
5. 装配图网仅提供信息存储空间,仅对用户上传内容的表现方式做保护处理,对用户上传分享的文档内容本身不做任何修改或编辑,并不能对任何下载内容负责。
6. 下载文件中如有侵权或不适当内容,请与我们联系,我们立即纠正。
7. 本站不保证下载资源的准确性、安全性和完整性, 同时也不承担用户因使用这些下载资源对自己和他人造成任何形式的伤害或损失。
