 CALCOMPELECTRONICS(CCET):NEWORDERSSHINELIGHTONGROWTH0131

《CALCOMPELECTRONICS(CCET):NEWORDERSSHINELIGHTONGROWTH0131》由会员分享,可在线阅读,更多相关《CALCOMPELECTRONICS(CCET):NEWORDERSSHINELIGHTONGROWTH0131(13页珍藏版)》请在装配图网上搜索。
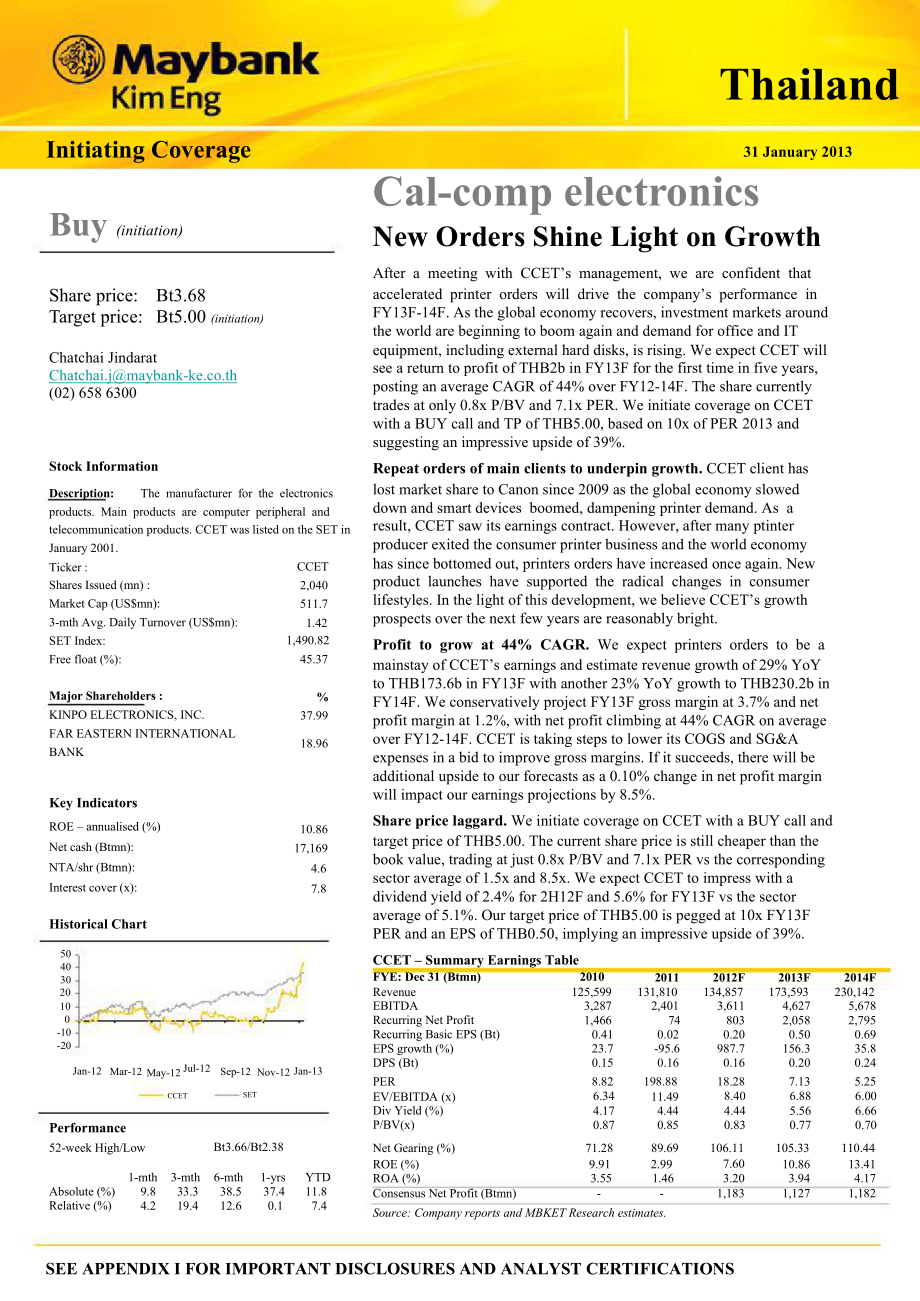
1、Mar-12May-12Jul-12Sep-12 Nov-12Jan-12Jan-131.4237.9918.96%ThailandInitiating CoverageBuy (initiation)31 January 2013Cal-comp electronicsNew Orders Shine Light on GrowthAfter a meeting with CCETs management, we are confident thatShare price:Target price:Bt3.68Bt5.00 (initiation)accelerated printer or
2、ders will drive the companys performance inFY13F-14F. As the global economy recovers, investment markets aroundthe world are beginning to boom again and demand for office and ITChatchai JindaratChatchai.jmaybank-ke.co.th(02) 658 6300Stock Informationequipment, including external hard disks, is risin
3、g. We expect CCET willsee a return to profit of THB2b in FY13F for the first time in five years,posting an average CAGR of 44% over FY12-14F. The share currentlytrades at only 0.8x P/BV and 7.1x PER. We initiate coverage on CCETwith a BUY call and TP of THB5.00, based on 10 x of PER 2013 andsuggesti
4、ng an impressive upside of 39%.Repeat orders of main clients to underpin growth. CCET client hasDescription:The manufacturer for the electronicslost market share to Canon since 2009 as the global economy slowedproducts. Main products are computer peripheral andtelecommunication products. CCET was li
5、sted on the SET inJanuary 2001.down and smart devices boomed, dampening printer demand. As aresult, CCET saw its earnings contract. However, after many ptinterproducer exited the consumer printer business and the world economyTicker :Shares Issued (mn) :Market Cap (US$mn):3-mth Avg. Daily Turnover (
6、US$mn):SET Index:Free float (%):Major Shareholders :KINPO ELECTRONICS, INC.FAR EASTERN INTERNATIONALBANKKey IndicatorsROE annualised (%)Net cash (Btmn):NTA/shr (Btmn):Interest cover (x):Historical ChartCCET2,040511.71,490.8245.3710.8617,1694.67.8has since bottomed out, printers orders have increased
7、 once again. Newproduct launches have supported the radical changes in consumerlifestyles. In the light of this development, we believe CCETs growthprospects over the next few years are reasonably bright.Profit to grow at 44% CAGR. We expect printers orders to be amainstay of CCETs earnings and esti
8、mate revenue growth of 29% YoYto THB173.6b in FY13F with another 23% YoY growth to THB230.2b inFY14F. We conservatively project FY13F gross margin at 3.7% and netprofit margin at 1.2%, with net profit climbing at 44% CAGR on averageover FY12-14F. CCET is taking steps to lower its COGS and SG&Aexpens
9、es in a bid to improve gross margins. If it succeeds, there will beadditional upside to our forecasts as a 0.10% change in net profit marginwill impact our earnings projections by 8.5%.Share price laggard. We initiate coverage on CCET with a BUY call andtarget price of THB5.00. The current share pri
10、ce is still cheaper than thebook value, trading at just 0.8x P/BV and 7.1x PER vs the correspondingsector average of 1.5x and 8.5x. We expect CCET to impress with adividend yield of 2.4% for 2H12F and 5.6% for FY13F vs the sectoraverage of 5.1%. Our target price of THB5.00 is pegged at 10 x FY13FPER
11、 and an EPS of THB0.50, implying an impressive upside of 39%.504030CCET Summary Earnings TableFYE: Dec 31 (Btmn) 201020112012F2013F2014F20100-10-20RevenueEBITDARecurring Net ProfitRecurring Basic EPS (Bt)EPS growth (%)DPS (Bt)PER125,5993,2871,4660.4123.70.158.82131,8102,401740.02-95.60.16198.88134,8
12、573,6118030.20987.70.1618.28173,5934,6272,0580.50156.30.207.13230,1425,6782,7950.6935.80.245.25Performance52-week High/LowCCETSETBt3.66/Bt2.38EV/EBITDA (x)Div Yield (%)P/BV(x)Net Gearing (%)6.344.170.8771.2811.494.440.8589.698.404.440.83106.116.885.560.77105.336.006.660.70110.44Absolute (%)Relative
13、(%)1-mth9.84.23-mth33.319.46-mth38.512.61-yrs37.40.1YTD11.87.4ROE (%) 9.91 2.99ROA (%) 3.55 1.46Consensus Net Profit (Btmn) - -Source: Company reports and MBKET Research estimates.7.603.201,18310.863.941,12713.414.171,182SEE APPENDIX I FOR IMPORTANT DISCLOSURES AND ANALYST CERTIFICATIONSCal-comp ele
14、ctronics (CCET)ValuationAs is the case with other electronics stocks, we value CCET based on thePER methodology. In our view, this method can more accurately reflectgrowth in the electronics sector over the next 12 months, with changeshinging on the world economy and technological advancements. Weha
15、ve decided against the DCF methodology, as we deem it is moresuitable to reflect company earnings over the long term.We conservatively value CCET at 10 x FY13F PER and expect net profitto grow 52% YoY to THB2.058b, implying an EPS of THB0.50. Our targetprice of THB5.00/ share suggests 39% upside gai
16、n. Initiate with BUY.Table 1: Valuation tableRecurring EPS20130.50520140.6859.010.011.012.04.55.05.66.16.26.97.58.2Source: MBKETCompany profileCCET is an original equipment manufacturer (OEM) and makeselectronics products for many of the worlds leading companies, such asWestern Digital, Seagate, Adv
17、anced Digital Broadcast, Hewlett Packard,Panasonic, Motorola, Nikon.As an original design manufacturer (ODM), CCET will conduct theresearch and design for each product on its own.The companys products can be divided into two main types:1. Computer products such as ink printer, multi-function printer
18、, PCcircuit for hard disk, PC circuit for external hard disk drive and PCcircuit for digital camera.2. Telecommunication products such as satellite receiver, mobilephone, earphone, Bluetooth equipment.31 January 2013PrinterExternal HDDSource: Company reportsKeyboardSet-top-boxPage 2 of 133.5%Cal-com
19、p electronics (CCET)Revenue breakdownIn 2011, CCET derived 86% of its revenue from computer products andthe remaining 14%, from telecommunication products. Printers and harddisk drives made up the bulk of computer products while satellitereceivers, Bluetooth equipment, mobile phone and ETC were its
20、maintelecommunication products.Chart 1: Revenue breakdown by product100%90%20.3%19.4%13.6%80%70%60%50%40%79.7%80.6%86.4%30%20%10%0%200920102011Computer equipmentTelecom equipmentSource: Company reportsClient market share loss hit CCET earnings from 2009Following the Great Financial Crisis in 2008-20
21、09, consumption growthand sector investments around the world slowed down. Meanwhile,competition in the printer market heated up, leading to client cedingmarket share to Canon.As a result, CCETs net profit declined by 39% YoY in 2009 and hasnever reached THB2b since then. Add the flood crisis at hom
22、e in 2011and the jump in expenses due to an acquisition in Brazil, CCETs netprofit tumbled yet again by another 69% YoY to THB513m in 2011.Fortunately, the company concentrated on HDD products during 2010-2011 and revenue kept growing even though gross margin was low.Starting this year, however, we
23、believe a return of printers orders will seeCCETs product mix change for the better with revenue and gross marginalso expected to improve.Chart 2: Net profit vs gross profit margin3,5003,0002,9015.0%6.0%5.0%2,5002,0001,5001,0005002,1283.7%1,301-39% YoY3.7%1,664-69% YoY5132.9%3.4%1,353+164% YoY2,0583
24、.7%+52% YoY4.0%3.0%2.0%1.0%00.0%200720082009201020112012E2013E31 January 2013Source: Company report, MBKETNetprofitGross profit marginPage 3 of 1311.70%Figures ofinclude desktop to mobile PCs,Cal-comp electronics (CCET)Profit likely to rebound to THB2b levelAfter a meeting with management, we are co
25、nfident that CCETs FY13F-14F performance will be driven by the acceleration in printers orders forprinters. Moreover, with the global economy recovering, investmentmarkets are beginning to boom again and there has been an increase indemand for office and IT equipment, including external hard disks.
26、Weexpect CCET will see a return to profit of THB2b in FY13F once again.Table 2: Worldwide hardcopy peripherals market share and growthSource: http:/Chart 3: Computers sold globally (USDm)Table 3: Computer sales all-time as of 2011Computer Sales All-Time4003503002502001501005060251134.7346.2321355.23
27、29Number of computer sales all-timeComputer sales revenue all-timePurpose and CharacteristicsPercent of computers sold for businessPercent of desktop computers soldPercent of laptop computers soldPercent of servers sold3.287 Billion$4.835 Trillion74%81.50%16.40%2.10%00.05Region of Sales1975200020102
28、011Percent of computers sold to the U.S.38.80%Percent of computers sold to Europe25%No. of computers sold globallyWorldw ide computer sales rev enuePercent computers soldPCs,Asia-Pacific and servers using the Intel x86 processorarchitectureSource: Gartner, International Data Corporation31 January 20
29、13Source: Gartner, International Data CorporationPage 4 of 1312-9-Cal-comp electronics (CCET)Table 4: Global PC market share by units soldRank3CompanyHPDellAcer201117.2 %*12.10%11.20%200919.3 %*12.90%12%200514.50%16.8 % *4.60%20007.60%10.80%456781011AppleLenovoAsusToshibaSamsungGatewayFujitsuNEC10.7
30、0%9.30%5.90%3.60%3.30%1.30%1.20%0.80%8%6.10%5.10%5.40%2.80%1.90%1.40%0.90%4%4.10%3.70%2.90%1.50%6.10%3.80%2%3.70%6.40%4.30%CompaqIBMMerged with HP in 2002Sold its PC business to Lenovo in 200512.8 %*6.80%Others24.40%24.20%36%47.60%*Year LeaderData includes desk-based PCs, Servers, mobile PCs, includ
31、ing mini-notebooks but not media tablets such as the iPad.Source: Gartner, International Data CorporationLow cost of production the main draw for clientreorderingThailands minimum wage will increase to THB300 per day this year, butthis is just a 58% rise compared with the 380% jump in Chinas minimum
32、wage over the past five years. The baht has appreciated in recent timesbut the difference in magnitude of increase vis-vis the yuan is only 5%(baht: +21%; yuan: +16%). Also considering that these are two politicallysensitive issues in China, more so than among its neighbours, we believeThailand will
33、 appeal to clients as an ideal location for its operations.Chart 4: China increase in minimum wageSource: BloombergChart 6: Yuan/US$Source: Bloomberg31 January 2013Chart 5: Thailand increase in minimum wageSource: BloombergChart 7: Baht/US$Source: BloombergPage 5 of 13Cal-comp electronics (CCET)Affi
34、liates to contribute to profit in 2H13FThe main drag on CCETs earnings are the EMS company in Brazil,which entailed capex spending of THB306.15m in 2011, and its affiliate inthe Philippines in 4Q12. Both have yet to break even and will still needthe support of CCET. In short, CCETs SG&A expenses hav
35、e been risingin the past few years, causing net margin to fall to below 1% vs 2-3%previously. Nevertheless, we estimate that both affiliates will be able toachieve breakeven in 2H13F because the utilization rate is increasingfrom increasing of orders.CCET is taking steps to control its expenses and
36、drive gross marginupwards as its revenue comes mainly from sales with a low net margin of1.19%. We estimate that a 1-2% change in net profit margin can drive netprofit up by as much as 100%.We expect FY13F net profit margin to be 1.19%, up from 1% in 2012 butstill below the 2-3% achieved in 2009. Ev
37、ery 0.1% increase in net marginwill cause our net profit projection to rise by 8.5%. Hence, if CCET canrein in its expenses, there will be upside to our projections.Table 5: Profit & NPM sensitivityNPM0.89%0.99%1.09%1.19%1.29%1.39%1.49%2.00%3.00%Net profit1,538.01,711.61,885.22,058.82,232.42,406.02,
38、579.63,471.95,207.8% Change-25%-17%-8%0%8%17%25%69%153%EPS0.380.420.460.500.550.590.630.851.28TP3.84.24.65.05.55.96.38.512.8Source: MBKETLimited impact from baht appreciationWith its revenue and over 90% of costs denominated in USD, we believethe recent baht appreciation will have little impact on C
39、CET. Indeed, thecompany stands to benefit from the weakening greenback and yen.Chart 8: % of operating natural hedgeChart 9: Foreign currency debt120%120%100%80%70%75%85%90%100%100%80%60%83%85%87%89%99%60%40%40%20%20%0%13%4%14%1%3%10%11%0%0% 1%0%KCESVIDELTAOperational HedgeCCETSMTSMTDELTAUS$ debtSVI
40、Yen debtOtherCCETKCESource: Company report31 January 2013Source: Company reportPage 6 of 13Cal-comp electronics (CCET)Share price lags book valueCCETs current share price is still cheaper than its book value, trading atjust 0.8x P/BV and 7.1x PER vs the corresponding sector average of 1.5xand 8.5x.
41、Of the electronics stocks under our coverage, CCET has thebiggest upside and the highest dividend payout.Table 6: CCET valuations vs the sectors (2013 data)P/BVPERYieldUpside gainCCETKCESMTSVIAverage0.771.311.832.091.507.138.088.5110.258.495.6%5.0%4.8%4.9%5.1%40%24%29%18%28%Source: MBKETProfit to po
42、st impressive growth until 2014FWe expect CCET to report 4Q12F net profit of THB304m, down 26%QoQ on seasonality. For the full year, however, net profit is expected tosurge 164% YoY to THB1.353b on only 2% YoY revenue growth, thanksto a one-off gain of THB338m in derivatives in 3Q12 and a turnaround
43、 netprofit from 4Q11. In FY12F, we believe CCET recorded a THB1.35b gainin derivatives against forex loss of just THB800m. We thus estimatenormalised profit at THB803m, up 988% YoY from THB74m in 2011.In our view, 2013 will turn out to be a good year for CCET, underpinnedby computer product sales, i
44、n particular printer orders. We estimaterevenue to expand 33% YoY to THB173.593b followed by growth ofanother 33% YoY to THB230.142b in FY14F. Gross margin is expectedto come in at 3.7% with net margin at 1.2% or THB2.058b, up 52% YoYin FY13F (EPS: THB0.50). In FY14F, we expect another 36% YoYgrowth
45、 to THB2.795b (EPS: THB0.69). All this means profit growth at aCAGR of 44% on average during FY12-14F, assuming a forex rate ofTHB30/USD.5% dividend yieldCCET pays dividends every year. In 1H12, it paid out THB0.80/share andwe expect the same amount in 2H12 (to be announced in the last week ofFebrua
46、ry). We are looking for a dividend yield of 2.2% for the full year. InFY13F, we expect dividend payout of THB0.20/share or 5.6% yield.Risks1. A strong baht may result in earnings growth falling short of ourestimate. However, we note that most of CCETs costs aredenominated in either USD or yen.2. Tec
47、hnological changes will affect clients businesses and, in turn,CCETs earnings.3. High interest expense due to M&A activities will squeeze CCETsliquidity. But we expect the impact to ease once the affiliates are ableto generate profit in 2013 and the coverage ratio could rise to 6.0 x in2012 and 7.8x
48、 in 2013 from 3.7x in 2011.31 January 2013Page 7 of 13Cal-comp electronics (CCET)Chart 10: Recurring profit and growthChart 11: EBITDA and dividend paid6,0005,677.85,322.43,0002,7955,0004,627.02,5002,0001,5001,3401,4662,058+36% YoY4,0003,0002,401.33,611.11,00050074803+988% YoY+156% YoY2,0001,000652.
49、4652.4734.0896.9909.8002009201020112012E2013E2014E20112012F2013F2014E2015EEBITDADiv idend paidSource: Company report, MBKET31 January 2013Source: Company report, MBKETPage 8 of 13-Cal-comp electronics (CCET)Cal-comp electronics Summary of FinancialsINCOME STATEMENT (Btmn)BALANCE SHEET (Btmn)FY Decem
50、berRevenueEBITDADepreciation & AmortisationOperating Profit (EBIT)Interest (Exp)/Inc2011131,8102,4011,5528492272012F134,8573,6111,6451,9663262013F173,5934,6271,7632,8643692014F230,1425,6781,8803,797408FY DecemberFixed AssetsOther LT AssetsCash/ST InvestmentsOther Current AssetsTotal Assets201112,894
51、4212,49542,23358,0422012F13,5674103,21244,31861,5072013F14,2304762,79455,11872,6192014F14,7775733,63472,13491,118Associates7000One-offsPre-Tax ProfitTaxMinority InterestNet ProfitRecurring Net Profit4396221090513745501,64028701,35380302,49543702,0582,05803,38959402,7952,795ST DebtOther Current Liabi
52、litiesLT DebtOther LT LiabilitiesMinority InterestShareholders Equity15,40325,402650017,17418,88024,773620017,79319,96333,643590018,95423,01447,208560020,839Total Liabilities-Capital58,04261,50772,61991,118Revenue Growth %4.92.328.732.6EBITDA Growth (%)EBIT Growth (%)Net Profit Growth (%)Recurring N
53、et Profit Growth (%)-27.0-57.5-69.2-95.050.4131.6163.7987.728.145.752.1156.322.732.635.835.8Share Capital (m)Gross Debt/(Cash)Net Debt/(Cash)Working Capital4,07815,40312,9083,9244,07818,88015,6683,8774,07819,96317,1694,3064,07823,01419,3805,546Tax Rate %17.517.517.517.5CASH FLOW (Btmn)RATES & RATIOS
54、FY DecemberProfit before taxationDepreciationNet interest receipts/(payments)Working capital changeCash tax paidOthers (incld exceptional items)Cash flow from operationsCapex20116221,552-227-4,182-109-483-2,828-3,2472012F1,6401,645-326-2,713-287-567-607-1,5002013F2,4951,763-369-1,931-437-789732-1,50
55、02014F3,3891,880-408-3,451-594-630186-1,500FY DecemberGross margin %EBITDA Margin %Op. Profit Margin %Net Profit Margin %ROE %ROA %Net Margin Ex. El %Dividend Cover (x)20112.91.80.60.43.01.50.10.12012F3.42.72.11.07.63.20.61.22013F3.72.71.81.210.93.91.22.52014F3.72.51.71.213.44.21.22.9Disposal/(purch
56、ase)Interest Cover (x)3.76.07.89.3OthersCash flow from investingDebt raised/(repaid)Equity raised/(repaid)Dividends (paid)Interest paymentsOthersCash flow from financing167-3,0813,430-552-652-2274292,4270-1,5003,4770-652-3263262,8250-1,5001,0830-734-3693693490-1,5003,0510-897-4084082,154Asset Turnov
57、er (x)Asset/Debt (x)Debtors Turn (days)Creditors Turn (days)Inventory Turn (days)Net Gearing %Debt/ EBITDA (x)Debt/ Market Cap (x)2.21.473.868.539.089.717.02.82.41.474.565.240.6106.112.13.02.51.474.568.936.5105.311.63.72.41.373.073.036.5110.412.44.8Change in cash-3,481718-418840Source: Company repor
58、ts and MBKET research31 January 2013Page 9 of 13Cal-comp electronics (CCET)RESEARCH OFFICESREGIONALP K BASURegional Head, Research & Economics(65) 6432 1821 pk.basumaybank-.sgWONG Chew Hann, CAActing Regional Head of Institutional Research(603) 2297 8686 wchewhmaybank-ONG Seng YeowRegional Products
59、& Planning(852) 2268 0644 ongsengyeowmaybank-.sgECONOMICSSuhaimi ILIASChief Economist Singapore | Malaysia(603) 2297 8682 suhaimi_iliasmaybank-Luz LORENZOEconomist Philippines | Indonesia(63) 2 849 8836 luz_lorenzomaybank-Tim LeelahaphanEconomist Thailand(662) 658 1420 tim.lmaybank-ke.co.thMALAYSIAW
60、ONG Chew Hann, CA Head of Research(603) 2297 8686 wchewhmaybank- Strategy Construction & InfrastructureDesmond CHNG, ACA(603) 2297 8680 desmond.chngmaybank- Banking - RegionalL IAW Thong Jung(603) 2297 8688 tjliawmaybank- Oil & Gas Automotive ShippingONG Chee Ting, CA(603) 2297 8678 ct.ongmaybank- P
61、lantationsMohshin AZIZ(603) 2297 8692 mohshin.azizmaybank- Aviation Petrochem PowerYIN Shao Yang, CPA(603) 2297 8916 samuel.ymaybank- Gaming Regional Media PowerTAN CHI WEI, CFA(603) 2297 8690 chiwei.tmaybank- Construction & Infrastructure PowerWONG Wei Sum, CFA(603) 2297 8679 weisummaybank- Propert
62、y & REITsLEE Yen Ling(603) 2297 8691 lee.ylmaybank- Building Materials Manufacturing TechnologyLEE Cheng Hooi Head of Retailchenghooi.leemaybank- TechnicalsHONG KONG / CHINAEdward FUNG Head of Research(852) 2268 0632 .hk ConstructionIvan CHEUNG, CFA(852) 2268 0634 .hk Property IndustrialIvan LI, CFA
63、(852) 2268 0641 .hk Banking & FinanceJacqueline KO, CFA(852) 2268 0633 .hk Consumer StaplesAndy POON(852) 2268 0645 .hk Telecom & equipmentAlex YEUNG(852) 2268 0636 .hk IndustrialWarren LAU(852) 2268 0644 .hk Technology - RegionalKaren Kwan(852) 2268 0640 .hk China PropertyJeremy TAN(852) 2268 0635
64、.hk GamingINDIAJigar SHAH Head of Research(91) 22 6623 2601 jigarmaybank-ke.co.in Oil & Gas Automobile CementAnubhav GUPTA(91) 22 6623 2605 anubhavmaybank-ke.co.in Metal & Mining Capital goods PropertyGanesh RAM(91) 226623 2607 ganeshrammaybank-ke.co.in Telecom ContractorSINGAPOREGregory YAP Head of
65、 Research(65) 6432 1450 gyapmaybank-.sg Technology & Manufacturing Telcos - RegionalWilson LIEW(65) 6432 1454 wilsonliewmaybank-.sg Hotel & Resort Property & ConstructionJames KOH(65) 6432 1431 jameskohmaybank-.sg Logistics Resources Consumer Small & Mid CapsYEAK Chee Keong, CFA(65) 6432 1460 yeakch
66、eekeongmaybank-.sg Healthcare Offshore & MarineAlison FOK(65) 6432 1447 alisonfokmaybank-.sg Services S-chipsBernard(65) 6432 1146 bernardchinmaybank-.sg Transport (Land, Shipping & Aviation)ONG Kian Lin(65) 6432 1470 ongkianlinmaybank-.sg REITs / PropertyWei Bin(65) 6432 1455 weibinmaybank-.sg S-chips Small & Mid CapsINDONESIAKatarina SETIAWAN Head of Research(62) 21 2557 1125 ksetiawanmaybank-ke.co.id Consumer Strategy TelcosLucky ARIESANDI, CFA(62) 21 2557 1127 lariesandimaybank-ke.co.id Base
- 温馨提示:
1: 本站所有资源如无特殊说明,都需要本地电脑安装OFFICE2007和PDF阅读器。图纸软件为CAD,CAXA,PROE,UG,SolidWorks等.压缩文件请下载最新的WinRAR软件解压。
2: 本站的文档不包含任何第三方提供的附件图纸等,如果需要附件,请联系上传者。文件的所有权益归上传用户所有。
3.本站RAR压缩包中若带图纸,网页内容里面会有图纸预览,若没有图纸预览就没有图纸。
4. 未经权益所有人同意不得将文件中的内容挪作商业或盈利用途。
5. 装配图网仅提供信息存储空间,仅对用户上传内容的表现方式做保护处理,对用户上传分享的文档内容本身不做任何修改或编辑,并不能对任何下载内容负责。
6. 下载文件中如有侵权或不适当内容,请与我们联系,我们立即纠正。
7. 本站不保证下载资源的准确性、安全性和完整性, 同时也不承担用户因使用这些下载资源对自己和他人造成任何形式的伤害或损失。
