 ASOSPLCASOS.LMALLTHATMEETSTHEEYE0129

《ASOSPLCASOS.LMALLTHATMEETSTHEEYE0129》由会员分享,可在线阅读,更多相关《ASOSPLCASOS.LMALLTHATMEETSTHEEYE0129(30页珍藏版)》请在装配图网上搜索。
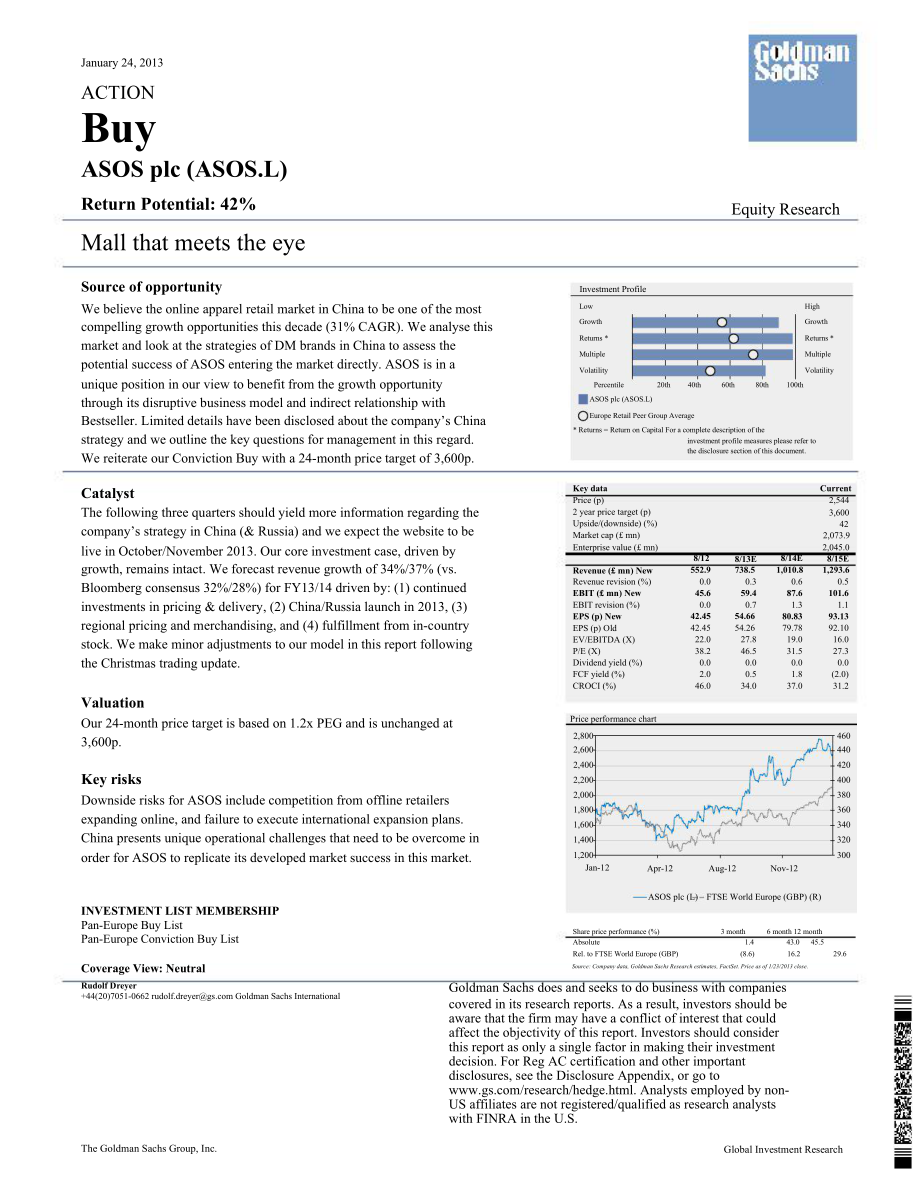
1、3,600January 24, 2013ACTIONBuyASOS plc (ASOS.L)Return Potential: 42%Mall that meets the eyeSource of opportunityInvestment ProfileEquity ResearchWe believe the online apparel retail market in China to be one of the mostcompelling growth opportunities this decade (31% CAGR). We analyse thismarket and
2、 look at the strategies of DM brands in China to assess thepotential success of ASOS entering the market directly. ASOS is in aLowGrowthReturns *MultipleVolatilityHighGrowthReturns *MultipleVolatilityunique position in our view to benefit from the growth opportunityPercentile20th40th60th80th100ththr
3、ough its disruptive business model and indirect relationship withBestseller. Limited details have been disclosed about the companys Chinastrategy and we outline the key questions for management in this regard.We reiterate our Conviction Buy with a 24-month price target of 3,600p.ASOS plc (ASOS.L)Eur
4、ope Retail Peer Group Average* Returns = Return on Capital For a complete description of theinvestment profile measures please refer tothe disclosure section of this document.CatalystThe following three quarters should yield more information regarding thecompanys strategy in China (& Russia) and we
5、expect the website to beKey dataPrice (p)2 year price target (p)Upside/(downside) (%)Market cap ( mn)Current2,544422,073.9live in October/November 2013. Our core investment case, driven bygrowth, remains intact. We forecast revenue growth of 34%/37% (vs.Bloomberg consensus 32%/28%) for FY13/14 drive
6、n by: (1) continuedinvestments in pricing & delivery, (2) China/Russia launch in 2013, (3)regional pricing and merchandising, and (4) fulfillment from in-countrystock. We make minor adjustments to our model in this report followingthe Christmas trading update.Enterprise value ( mn)Revenue ( mn) NewR
7、evenue revision (%)EBIT ( mn) NewEBIT revision (%)EPS (p) NewEPS (p) OldEV/EBITDA (X)P/E (X)Dividend yield (%)FCF yield (%)CROCI (%)8/12552.90.045.60.042.4542.4522.038.20.02.046.08/13E738.50.359.40.754.6654.2627.846.50.00.534.08/14E1,010.80.687.61.380.8379.7819.031.50.01.837.02,045.08/15E1,293.60.51
8、01.61.193.1392.1016.027.30.0(2.0)31.2ValuationOur 24-month price target is based on 1.2x PEG and is unchanged atPrice performance chart3,600p.Key risksDownside risks for ASOS include competition from offline retailersexpanding online, and failure to execute international expansion plans.China presen
9、ts unique operational challenges that need to be overcome in2,8002,6002,4002,2002,0001,8001,6001,400460440420400380360340320order for ASOS to replicate its developed market success in this market.1,200Jan-12Apr-12Aug-12Nov-12300INVESTMENT LIST MEMBERSHIPASOS plc (L)FTSE World Europe (GBP) (R)Pan-Eur
10、ope Buy ListPan-Europe Conviction Buy ListShare price performance (%)Absolute3 month1.46 month 12 month43.0 45.5Rel. to FTSE World Europe (GBP)(8.6)16.229.6Coverage View: NeutralRudolf Dreyer+44(20)7051-0662 Goldman Sachs InternationalThe Goldman Sachs Group, Inc.Source: Company data, Goldman Sachs
11、Research estimates, FactSet. Price as of 1/23/2013 close.Goldman Sachs does and seeks to do business with companiescovered in its research reports. As a result, investors should beaware that the firm may have a conflict of interest that couldaffect the objectivity of this report. Investors should co
12、nsiderthis report as only a single factor in making their investmentdecision. For Reg AC certification and other importantdisclosures, see the Disclosure Appendix, or go Analysts employed by non-US affiliates are not registered/qualified as research analystswith FINRA in the U.S.Global Investment Re
13、search-2January 24, 2013ASOS plc: Summary FinancialsASOS plc (ASOS.L)Profit model ( mn)Total revenueOperating costsR&DLease paymentsOther operating profit/(expense)EBITDADepreciation & amortisationEBITNet interest income/(expense)Associates8/12552.9(491.0)0.0(6.1)(6.1)55.8(10.2)45.6(1.1)0.08/13E738.
14、5(656.7)0.0(8.1)(8.1)73.7(14.2)59.40.30.08/14E1,010.8(892.9)0.0(11.1)(11.1)106.8(19.2)87.60.40.08/15E1,293.6(1,148.5)0.0(14.2)(14.2)130.9(29.2)101.60.80.0Balance sheet ( mn)Cash & equivalentsAccounts receivableInventoryOther current assetsTotal current assetsNet PP&ENet intangiblesTotal investmentsO
15、ther long-term assetsTotal assets8/1227.919.1100.30.0147.249.51.18.50.0206.38/13E39.225.3140.20.0204.870.21.18.50.0284.68/14E76.834.6191.40.0302.886.01.18.50.0398.48/15E34.744.3244.50.0323.6191.81.18.50.0525.0Profit/(loss) on disposals0.00.00.00.0Others (recurring)Pretax profitsIncome taxTax rate (%
16、)MinoritiesPreferred dividendsNet income (pre-exceptionals)Other non-recurring items post tax0.044.5(11.6)26.00.00.032.9(3.4)0.059.7(14.9)25.00.00.044.8(3.8)0.088.0(21.1)24.00.00.066.9(3.8)0.0102.4(24.6)24.00.00.077.8(3.9)Accounts payableShort-term debtOther current liabilitiesTotal current liabilit
17、iesLong-term debtOther long-term liabilitiesTotal long-term liabilitiesTotal liabilities100.30.00.0100.30.013.513.5113.8137.60.00.0137.60.013.513.5151.0188.30.00.0188.30.013.513.5201.8241.00.00.0241.00.013.513.5254.5Net income29.541.063.073.9EPS (underlying) (p)EPS (basic, reported) (p)Weighted shar
18、es outstanding (mn)Common dividends declaredDPS (p)Dividend payout ratio (%)42.4538.1277.50.00.000.054.6650.0881.90.00.000.080.8376.1982.70.00.000.093.1388.4283.60.00.000.0Preferred sharesTotal common equityMinority interestTotal liabilities & equityCapitalised leasesCapital employed0.092.50.0206.34
19、8.792.50.0133.60.0284.665.0133.60.0196.60.0398.489.0196.60.0270.50.0525.0113.8270.5Dividend cover (X)NMNMNMNMGrowth & margins (%)Revenue growthEBITDA growth8/1237.246.58/13E33.632.08/14E36.945.18/15E28.022.5Adj for unfunded pensions & GWAdj capital employedGross cash invested(1.1)91.5149.5(1.1)132.5
20、209.7(1.1)195.5278.4(1.1)269.4448.5EBIT growth42.130.447.416.0Net income growthEPS growthDPS growthEBITDA marginEBIT margin237.014.6-10.18.238.928.7-10.08.053.747.9-10.68.717.215.2-10.17.9RatiosCROCI (%)CROCI/WACC (X)ROIC (%)ROIC/WACC (X)8/1246.05.345.85.38/13E34.03.931.63.78/14E37.04.332.33.78/15E3
21、1.23.627.13.1ROA (%)20.416.817.915.6Cash flow statement ( mn)Net incomeD&A add-back (incl. ESO)Minority interest add-backNet (inc)/dec working capital8/1232.910.20.0(9.9)8/13E44.814.20.0(8.9)8/14E66.919.20.0(9.7)8/15E77.829.20.0(10.2)WACC (%)Inventory daysAsset turnover (X)Net debt/equity (%)EBITDA
22、interest cover (X)8.735.012.5(30.1)50.38.759.412.3(29.4)(264.1)8.759.912.9(39.1)(272.3)8.761.59.3(12.8)(170.4)Other operating cash flow13.0(3.8)(3.8)(3.9)Cash flow from operations46.246.472.592.9Valuation8/128/13E8/14E8/15EEV/sales (X)2.22.82.01.6Capital expendituresAcquisitionsDivestituresOthersCas
23、h flow from investing(21.7)0.00.00.0(21.7)(35.0)0.00.00.0(35.0)(35.0)0.00.00.0(35.0)(135.0)0.00.00.0(135.0)EV/EBITDAR (X)EV/EBITDA (X)EV/EBIT (X)P/E (X)Dividend yield (%)20.622.024.738.20.025.827.831.246.50.017.919.021.431.50.015.216.019.027.30.0FCF yield (%)2.00.51.8(2.0)Dividends paid (common & pr
24、ef)Inc/(dec) in debtOther financing cash flows0.0(10.0)(0.9)0.00.00.00.00.00.00.00.00.0EV/GCI (X)EV/adj. capital employed (X)Price/book (X)8.520.116.110.122.615.77.617.810.84.99.47.9Cash flow from financing(10.9)0.00.00.0Total cash flowCapex/D&A (%)Reinvestment rate (%)Cash flow cover of dividends (
25、X)13.7211.838.6NM11.4246.163.3NM37.5182.142.5NM(42.1)461.9130.9NMNote: Ratios are adjusted for leases where appropriate. Only separately disclosed where significant and ongoing.Note: Last actual year may include reported and estimated data.Free cash flow cover of dividends (X)Analyst ContributorsRud
26、olf DGoldman Sachs Global Investment ResearchSource: Company data, Goldman Sachs Research estimates.4691118253January 24, 2013Table of contentsASOS our thesis in six chartsASOS 5 reasons why the company is well positionedASOS plc (ASOS.L)1.2.3.4.5.Premium pricing of DM competitors creates an opportu
27、nityLower sourcing and distribution cost relative to Europe28% shareholder is already leading in ChinaThey have done it beforeLower capital requirement of partnership model66678ASOS 5 key questions for management1.2.3.4.5.Pricing strategy?Marketing strategy?Merchandising in China?Overlap with online
28、 shopping mall platforms?Cost of operating in China?9910101010 China online observations too much growth to ignore1.2.3.4.5.6.8.9.10.China already prominent in global online trafficOnline already represents 4.1% of retail spend in ChinaElectronics and apparel leading online retail in ChinaOnline can
29、nibalizing high street faster than DMC2C leads online retail in China (for now)B2C dominated by mall platformsPureplay online retailers also operate in mall dominated marketForeign competitors lag behind their Chinese peersChinese online apparel market to grow 31% CAGR to 202011111212131415161610 ob
30、servations of DM brands in China premium pricing1.2.3.4.5.6.7.8.9.10.Limited high-street position for DM brandsAll online at home, but only 65% in ChinaBigger high-street footprint = more likely to be online in ChinaMall platforms the preferred online channel for DM brandsDM brands offer narrower se
31、lection in ChinaPremium price in China: RANGEPremium price in China: AVERAGEPremium price in China: LIKE-FOR-LIKEPremium pricing not a barrier to brand market shareChinese customers pay less for delivery on .CN sites18181919202121222323Appendix selecting 23 DM apparel brandsDisclosure AppendixThe au
32、thors would like to thank Theodora Lee Joseph for her contribution to this report.The prices in the body of this report are based on the market close of January 23, 2013.Goldman Sachs Global Investment Research274January 24, 2013ASOS our thesis in six chartsExhibit 1: ASOS leading global trafficAver
33、age Daily visitors (000s) - Comscore rankings forAugust 20127006005004003002001000ASOS plc (ASOS.L)Exhibit 2: with an increasingly global traffic mixUK & international traffic split ASOS.com, Internationalsides and mobile sites100%90%80%70%60%50%40%30%20%10%0%Aug 09Aug 10UKAug 11InternationalAug 12S
34、ource: Comscore, Company data.Exhibit 3: driving globalisation of revenue mixGeographical split of sales and GM movementSource: Company data.Exhibit 4: ASOS leads revenue growth in retailPeer group sales and EBIT CAGR (CY12-14E)100%90%80%70%60%50%40%30%20%10%0%53.0%52.0%51.0%50.0%49.0%48.0%47.0%45%4
35、0%35%30%25%20%15%10%5%20092010201120122013E2014E2015E2016E0%ASOSYOOXInditexTed BakerH&MStockmannNextRetailUKInternationalGrossmargin(LHS)SalesEBITMedian (ex.ASOS andYOOX)Source: Company data, Goldman Sachs Research estimates.Exhibit 5: Leading cash returns 30%Asset turn, EBITDA margin and CROCISourc
36、e: Goldman Sachs Research estimates.Exhibit 6: Growing into multipleEV/EBITDA progression on our earnings forecasts45x45%40%35%30%25%20%15%10%5%6.x5.x4.x3.x2.x1.x40 x35x30 x25x20 x15x10 x0%201120122013E2014E2015E2016E2017E.x5xEBITDA marginAsset turnover (RHS)CROCICash conversion (RHS)0 x200620072008
37、20092010201120122013201420152016Source: Datastream, Goldman Sachs Research estimates.Goldman Sachs Global Investment ResearchSource: Datastream, Goldman Sachs Research estimates.5January 24, 2013ASOS plc (ASOS.L)Mall that meets the eyeThe growth potential of online apparel retail in China is one of
38、the most compellingthis decade and we estimate the market to grow 31% CAGR to 2020. We believeASOS is in a very strong position to benefit from the growth opportunity in Chinaonline retail and review the opportunity ahead of the launch of the website later thisyear.China online apparel a leading gro
39、wth opportunityThe Chinese online apparel market is only half the size of the US online apparel markettoday but we expect it to be a multiple of the US by the end of the decade, driven by (1)growth in disposable income, (2) online cannibalisation of offline retail, and (3) increasedinternet penetrat
40、ion thanks to urbanisation and the increased penetration of smartphones.We forecast this $12 bn market to reach $103 bn in 2020, a growth rate of 31% (8yr CAGR).Unique and evolving market structureThe Chinese online apparel market is dominated by C2C retail and in the B2C part of themarket by online
41、 retail malls rather than individual retailer websites. We believe theevolution of the market will lead to (1) B2C taking a greater share of the retail activity and(2) the brand-specific websites gaining more share and operate alongside the online retailmalls as customers become more sophisticated.
42、This evolution is however sensitive tothe regulatory environment within which the online marketplace operates.Premium pricing for DM brandsDeveloped market apparel brands have increased their presence in online China. Thesebrands also follow a consistent strategy of premium pricing compared to their
43、 homemarkets and local Chinese brands. The median mark-up of 24% points to compellinggross margin dynamics for DM brands in China.Significant opportunity for ASOS to disruptWe believe the premium pricing of DM brands provides significant room for ASOS todisrupt existing DM retail strategies for onli
44、ne China. This is predominantly due to thepremium pricing strategy followed in China, which opens up the potential for ASOS toprice down more relative to its existing markets or generate a higher margin.Four other factors are considered key positives: (1) we expect sourcing cost to be better inChina
45、 due to the proximity of suppliers, (2) a bias to own brand would be gross marginaccretive, (3) lower delivery cost in China should be a positive for the free delivery modelas the delivery cost saving goes to the retailer, and (4) a partnership model fordistribution could lower the overall capital i
46、ntensity of the business even further.Key questions for ASOS managementThe ASOS strategy remains under wraps and we highlight five key questions formanagement: (1) China pricing strategy? (2) Marketing strategy as a fast follower? (3)Product offering? (4) Overlap with online shopping mall platforms?
47、 (5) The cost ofoperating in China and the related legal/operational challenges?Goldman Sachs Global Investment Research6January 24, 2013ASOS plc (ASOS.L)ASOS 5 reasons why the company is well positionedWe believe ASOS is in a unique position to benefit from the growth opportunity inChina outlined i
48、n this report. Its disruptive business model (lower price points andfree delivery) should serve it well in our view and the company could benefit from ashareholder linked with a leader in China retail apparel (Bestseller AS). We forecastthat if ASOS can engage only 3% of the addressable market in Ch
49、ina (16-35 agegroup, with internet access) the country could represent 25% of group retail sales in2020. At present ASOS active customer base in the UK represents 15% of theaddressable market.1. Premium pricing of DM competitors creates an opportunityPricing in China presents a unique conundrum for
50、ASOS. The pricing strategy of foreignretailers suggests that ASOS has the potential to price up compared to its DM pricing.This could translate into higher gross margins for the group. However, premium pricingalso presents an opportunity to be even more disruptive in China than in DM. This alsoappli
51、es to pureplay online competitors, as an example the ASP of a pair of ASOSwomens jeans is $57 compared to $65 at Vancl. We currently forecast the company tomaintain its EBIT margin around 8% over the medium-term (pre-option expense).2. Lower sourcing and distribution cost relative to EuropeApart fro
52、m the positive pricing element, ASOS stands to benefit from lower sourcing anddistribution costs relative to Europe. This could also play into ASOS strategy ofdisrupting the apparel retail market. Current production of ASOS own brand apparel is inChina, implying lower sourcing costs as the transport
53、ation cost of product will be lower.The lower underlying cost of delivery in China should also translate into relative costsavings for ASOS as it already offers free international delivery this means the saving inactual delivery cost should accrue directly to ASOS. Note that we forecast distribution
54、costs, which includes the costs of delivery and returns, to reach 15.4% of sales in FY13.The distribution of product in China is however different to developed markets whereASOS is active and this presents new challenges, e.g. payment and delivery options.3. 28% shareholder is already leading in Chi
55、naBestseller owns three of the top brands in China (Exhibit 8) and a related investmentvehicle currently owns 28% of ASOS, a figure that has increased from 5% in 2Q10. Webelieve the shareholder relationship could be a key positive in understanding theconsumer in China and providing infrastructure fo
56、r ASOS. There has however been noindication to date that the companies are interacting at an operational level.Goldman Sachs Global Investment Research7January 24, 2013Exhibit 7: Bestseller increasingly buying into ASOSBestseller AS holdings of ASOS (November 28, 2012)ASOS plc (ASOS.L)Exhibit 8: Bes
57、tsellers Chinese market knowledgetranslating into tangible sales growthSales of Bestseller Groups brands in China (Rmb mn)30%25%23.40%28.04%5,0004,5004,000Jack&Jones20%16.60%19.70%21.00%3,5003,000OnlyVeroModa15%10%2,5002,0001,5005%0%5.20%1,000500010Q210Q411Q211Q412Q212Q4200620072008200920102011Sourc
58、e: Company Data, BloombergSource: Euromonitor4. They have done it beforeASOS experience in entering new markets outside the UK and executing effectively inhigh growth environments increases our confidence regarding the companys ability topenetrate the China online market.The existence of pureplay on
59、line retailers in the Chinese market over and above theonline shopping mall business models indicate that there are obvious barriers thatprevent pureplay online retailers from operating in this market.Exhibit 9: ASOS growing revenue streams fromdeveloped marketsProfile of ASOS sales in US and Europe
60、 ( mn)180Exhibit 10: ASOS knack in penetrating tough marketsMarket share of ASOS in UK, US and EU (FR, DE, IT, ES)4.0%UK1601403.5%3.0%3.8%3.7%1202.5%100US2.0%80EU60401.5%1.0%1.3%EU*200.5%0.4%0.3%US0.0%00.0%20092010201120122013E2009201020112012Source: Company data.Source: Euromonitor, Company data, G
61、oldman Sachs ResearchWe believe the dominance of Tmall is expected to shift as the Chinese online apparelmarket matures and becomes more balanced, with specialist category online retailersbecome relevant competitors. Exhibit 11 shows that of the online stores that grew fasterthan Tmall in 2011, c.90
62、% of them were specialist category e-tailers. We expect this trendto continue as the market matures and is a positive trend for ASOS.Goldman Sachs Global Investment ResearchYiHaoDNewEMoonBRedBShop.QQ.com360BMBaoBDangDGLeF51BXOkBVATCVipSHSLeT8January 24, 2013ASOS plc (ASOS.L)Exhibit 11: Specialist ca
63、tegory e-tailers growing fast and gaining market share from superstores like TmallRevenue growth in 2011 of top 22 e-tailer operations by revenue size (in Black: Specialist category e-tailers with higher growththan Tmall)500%450%400%350%300%250%Tmall200%150%100%50%0%Source: iResearch5. Lower capital
64、 requirement of partnership modelCompared to the potential upside from entering the Chinese market, the downside risksare also mitigated by the limited capital commitment required from China is the companydoes partner in distribution.Goldman Sachs Global Investment Research9January 24, 2013ASOS plc
65、(ASOS.L)ASOS 5 key questions for managementWe believe the opportunity is significant and ASOS is very well positioned to capitalise ona local presence in the Chinese market. There are however a number of strategicdirections the company can take leading to very different opportunities and risks in ou
66、rview. The company has provided a roadmap for its overall group strategy (Exhibit 12), butwe have limited information regarding its China specific strategy. Thus far we only knowthat ASOS will be directly active in China by October/November 2013, it will use adistribution partner to fulfill orders from within China and at launch is likely to be biasedtowards its own brand product.We outline five strategic questions for management, which also highlight the key risks forASOS in expanding its ope
- 温馨提示:
1: 本站所有资源如无特殊说明,都需要本地电脑安装OFFICE2007和PDF阅读器。图纸软件为CAD,CAXA,PROE,UG,SolidWorks等.压缩文件请下载最新的WinRAR软件解压。
2: 本站的文档不包含任何第三方提供的附件图纸等,如果需要附件,请联系上传者。文件的所有权益归上传用户所有。
3.本站RAR压缩包中若带图纸,网页内容里面会有图纸预览,若没有图纸预览就没有图纸。
4. 未经权益所有人同意不得将文件中的内容挪作商业或盈利用途。
5. 装配图网仅提供信息存储空间,仅对用户上传内容的表现方式做保护处理,对用户上传分享的文档内容本身不做任何修改或编辑,并不能对任何下载内容负责。
6. 下载文件中如有侵权或不适当内容,请与我们联系,我们立即纠正。
7. 本站不保证下载资源的准确性、安全性和完整性, 同时也不承担用户因使用这些下载资源对自己和他人造成任何形式的伤害或损失。
最新文档
- 嵌入式系统概论-以S3C2440核心为架构课件
- 地理事象的季节变化课件
- 地理中外著名旅游景观欣赏课件
- 地理中图版选修5第一章第二节主要自然灾害及其分布课件
- 地理中考复习-地图课件
- 北师大版历史八年级下册第17课《筑起钢铁长城》课件1
- 北师大版历史八下《祖国统一的历史大潮》课件5
- 北师大版历史八下《欣欣向荣的科教文体事业》3课件
- 北师大版历史八下《蓝色的地中海文明》课件
- 北师大版历史九年级下册第10课“冷战”与“热战”丁飞鹤T-课件
- 北师大版历史八下第17课《大河流域的文明曙光》课件
- 北师大版历史九上1718课课件
- 高中化学热力学复习10多重平衡与化学计算ppt课件
- 高中化学第1章化学反应与能量转化第3节化学能转化为电能电池ppt课件1鲁科版选修
- 高中化学第三节玻璃、陶瓷和水泥公开课课件
