 KOREAREFININGANDCHEMICALS3Q12EARNINGSPREVIEWSUPERFICIALSTRENGTHLARGELYDRIVENONEOFFGAINS1011

《KOREAREFININGANDCHEMICALS3Q12EARNINGSPREVIEWSUPERFICIALSTRENGTHLARGELYDRIVENONEOFFGAINS1011》由会员分享,可在线阅读,更多相关《KOREAREFININGANDCHEMICALS3Q12EARNINGSPREVIEWSUPERFICIALSTRENGTHLARGELYDRIVENONEOFFGAINS1011(16页珍藏版)》请在装配图网上搜索。
1、FlashnoteNatural Resources & energyChemicals/RefiningEquity KoreaabcGlobal ResearchKorea Refining and Chemicals3Q12 earnings preview: superficial strength, largely drivenby one-off gains 3Q12 results should show a sequential bounce, but the maindrivers are non-recurring gains related to the bounce i
2、ncrude prices, not the underlying margins Refiner earnings unlikely to be as good as the 5-year high GRMindicates; SKI likely to be disappointing compared to its peers Chemical earnings remain depressed; high valuationmultiples paid on hope of a recovery could lose grounds9 October 2012Dennis Yoo*,
3、CFAAnalystThe Hongkong and Shanghai BankingCorporation Limited+852 2996 .hkBrian Sohn*AnalystThe Hongkong and Shanghai BankingCorporation Limited, Seoul SecuritiesBranch+822 3706 Thomas C Hilboldt*, CFAAnalystThe Hongkong and Shanghai BankingCorporation Limited+852 2822 .hkView HSBC Global Research
4、at:http:/*Employed by a non-US affiliate ofHSBC Securities (USA) Inc, and is notregistered/qualified pursuant to FINRAregulationsIssuer of The Hongkong andreport: Shanghai BankingCorporation LimitedDisclaimer &DisclosuresThis report must be readwith the disclosures andthe analyst certifications inth
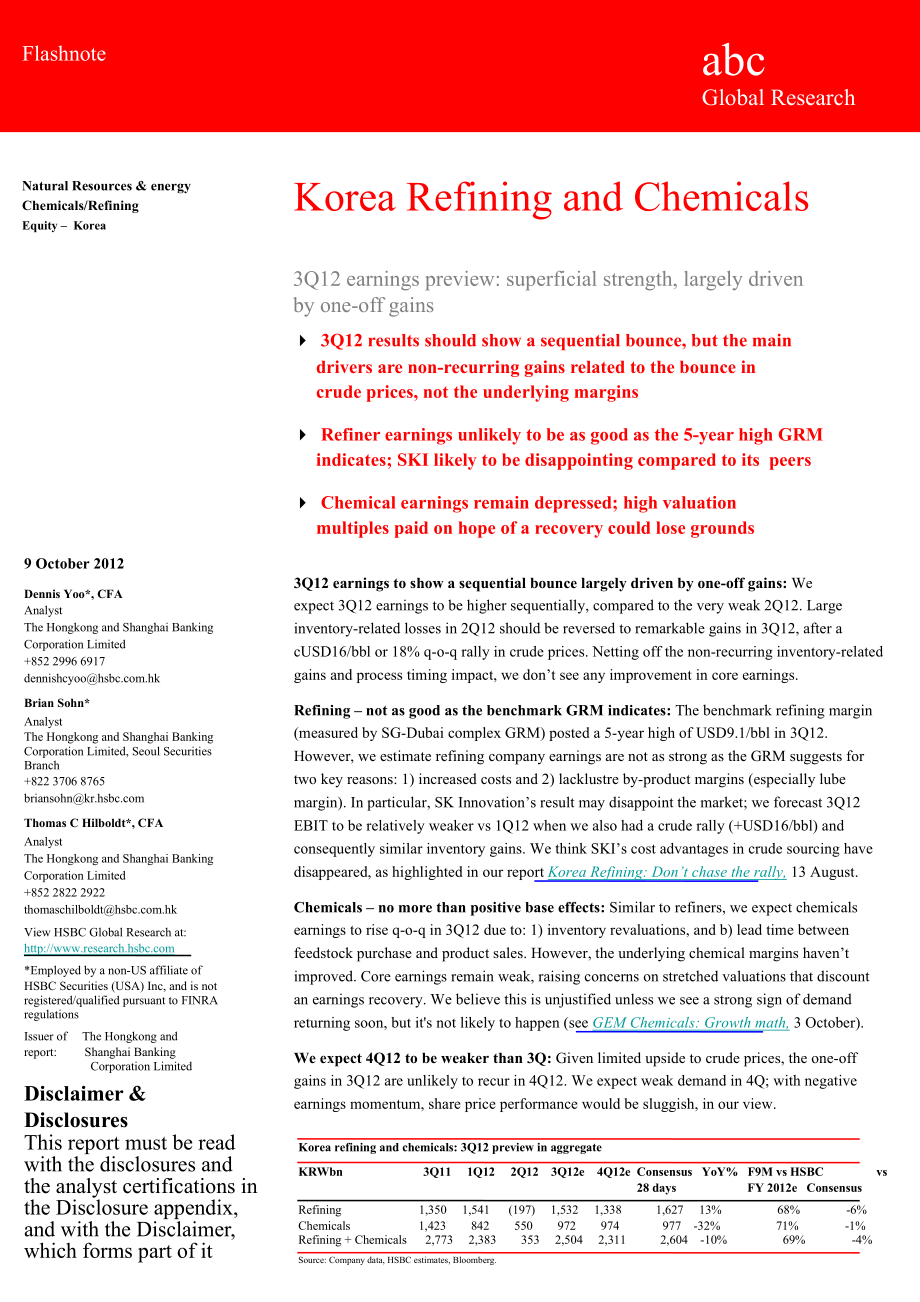
5、e Disclosure appendix,and with the Disclaimer,which forms part of it3Q12 earnings to show a sequential bounce largely driven by one-off gains: Weexpect 3Q12 earnings to be higher sequentially, compared to the very weak 2Q12. Largeinventory-related losses in 2Q12 should be reversed to remarkable gain
6、s in 3Q12, after acUSD16/bbl or 18% q-o-q rally in crude prices. Netting off the non-recurring inventory-relatedgains and process timing impact, we dont see any improvement in core earnings.Refining not as good as the benchmark GRM indicates: The benchmark refining margin(measured by SG-Dubai comple
7、x GRM) posted a 5-year high of USD9.1/bbl in 3Q12.However, we estimate refining company earnings are not as strong as the GRM suggests fortwo key reasons: 1) increased costs and 2) lacklustre by-product margins (especially lubemargin). In particular, SK Innovations result may disappoint the market;
8、we forecast 3Q12EBIT to be relatively weaker vs 1Q12 when we also had a crude rally (+USD16/bbl) andconsequently similar inventory gains. We think SKIs cost advantages in crude sourcing havedisappeared, as highlighted in our report Korea Refining: Dont chase the rally, 13 August.Chemicals no more th
9、an positive base effects: Similar to refiners, we expect chemicalsearnings to rise q-o-q in 3Q12 due to: 1) inventory revaluations, and b) lead time betweenfeedstock purchase and product sales. However, the underlying chemical margins haventimproved. Core earnings remain weak, raising concerns on st
10、retched valuations that discountan earnings recovery. We believe this is unjustified unless we see a strong sign of demandreturning soon, but its not likely to happen (see GEM Chemicals: Growth math, 3 October).We expect 4Q12 to be weaker than 3Q: Given limited upside to crude prices, the one-offgai
11、ns in 3Q12 are unlikely to recur in 4Q12. We expect weak demand in 4Q; with negativeearnings momentum, share price performance would be sluggish, in our view.Korea refining and chemicals: 3Q12 preview in aggregateKRWbn 3Q11 1Q12 2Q12 3Q12e 4Q12e Consensus YoY% F9M vs HSBC vs28 days FY 2012e Consensu
12、sRefining 1,350 1,541 (197) 1,532 1,338 1,627 13% 68% -6%Chemicals 1,423 842 550 972 974 977 -32% 71% -1%Refining + Chemicals 2,773 2,383 353 2,504 2,311 2,604 -10% 69% -4%Source: Company data, HSBC estimates, Bloomberg.Korea Refining and ChemicalsChemicals/Refining9 October 2012Korea refining 3Q12e
13、 EBIT forecast / core earnings vs consensus normalised quarterly EBIT (2013e quarterly avg.)abcKRWbn3Q111Q122Q123Q12eEst. 28d vs Core Consensus FY13 (B)/(A)one-offs consensus Consensus % Earnings (A) quarterly avg (B)SK InnovationGS Holdings862120926233-10670773296200-25070-100818315-5%-6%5482117082
14、85129%135%Source: Company data, Bloomberg, HSBC estimates3Q12e preview: Korea refiningSK Innovation (096770 KS, N(V), KRW159,500, TP KRW170,000) We estimate SKI to post an EBIT of cKRW773bn, significantly higher than a quarter ago(+cKRW880bn q-o-q). cUSD16/bbl rise in crude price during the quarter
15、is estimated to have contributedcKRW200-250bn. Core EBIT net of one-off gains are cKRW550bn only, which is disappointingcompared with the consensus normalised quarterly EBIT of cKRW650bn. For refining companies like SKI, 1Q12 is a good comparable as in the first quarter, we saw a similar sizeof crud
16、e rally (+cUSD16/bbl). Despite better GRM (USD7.7/bbl vs USD9.1/bbl in 3Q) SKIs refiningsegment is not likely to post strong performance in 3Q as in 1Q (c.f. in 1Q12 realised cash refining marginfor SKI was estimated to be cUSD8/bbl) we think, because opportunities to source cheaper crude oilsbecame
17、 scarce in 3Q. (See Korea Refining: Dont chase the rally published in Aug 2012 for details). Despite all the new lube capacities are coming online and fully utilised, incremental earnings contributionfrom the lube segment would be minimal. Lube base oil price hasnt been raised much during thequarter
18、 while raw material costs have increased, resulting in a margin squeeze.GS Holdings (078930 KS, OW(V), KRW64,300, TP KRW75,500) We estimate GSH to achieve cKRW296bn of consolidated EBIT in 3Q12, from KRW70bn in 2Q12, onthe back of: 1) increased equity method gain from GS Caltexs refining business (f
19、rom -KRW44bn to+cKRW184bn) and 2) outstanding GS Retails performance. We expect GS Retail to post a continuous double-digit top-line growth as well as margin expansions on theback of aggressive expansion of the convenience store (CVS) channels. In 4Q12, we believe the elimination of one-off gains wi
20、ll be offset by earnings growth from GS Retail andseasonal strength of its power & utility businesses.2Korea Refining and ChemicalsChemicals/Refining9 October 2012Korea chemicals 3Q12e EBIT forecast / core earnings vs consensus normalised quarterly EBIT (2013e quarterly avg.)abcKRWbn3Q111Q122Q12 3Q1
21、2eEst. 28d vs Core Consensus FY13 (B)/(A)one-offs consensus Consensus % Earnings (A) quarterly avg (B)LG ChemHonam PetrochemKumho PetrochemHanwha Chem7243972198346022013132503-282945627209637380-100100-15020-5020-5062021370741%-2%-10%-2%53784283867028016098125%332%579%260%Source: Company data, Bloom
22、berg, HSBC estimates3Q12e preview: Korea chemicalsLG Chemical (051910 KS, OW(V), KRW329,000, TP KRW410,000) We expect LG Chemical to post 3Q12 OP of cKRW627bn, 25% higher than 2Q12 on the back ofinventory revaluation gains and stable IT material earnings. Earnings from EV battery are expected todecr
23、ease marginally due to a temporary disruption of GM Volt production. Capacity expansions completed in 3Q12 should contribute to earnings growth in 4Q12 naphtha crackercapacity revamp (+70ktpa), acrylic acid (+160ktpa) and Super Absolvent Polymer (+72ktpa). Inparticular, acrylic acid and SAP should f
24、urther benefit from Nippon Shokubais recent plant outage. However, we expect flat earnings in 4Q12 due to end-loaded employee bonus and one-off costs.Honam Petrochem (011170 KS, UW(V), KRW244,500, TP KRW220,000) Honam should record the strongest q-o-q momentum among the chemical companies we cover,m
25、ainly on 1-1.5 months of lead time for naphtha sourcing while naphtha price has risen more than30% during the quarter. We forecast cKRW209bn in EBIT in 3Q, with such one-off gain contributingmore than KRW100bn. Underlying chemical margins should be largely unchanged, with improved MEG margin being o
26、ffsetby a fall in BD price. Downstream polyester business operated by a subsidiary KP Chem shouldremain depressed. We are concerned about an expected weaker 4Q12 earnings, when gains related to naphtha sourcingfades. Consensus quarterly average EBIT for 2013e is cKRW280bn vs core earnings at cKRW84b
27、n in3Q12. We anticipate consensus forecasts to be cut over 4Q12 and valuation will lose ground as a result.Kumho Petrochem (011780 KS, N(V), KRW116,500, TP KRW130,000) We estimate 3Q12 earnings to be more than double sequentially (cKRW63bn, +115% q-o-q) from avery low base in 2Q12. EBIT from the syn
28、thetic rubber division is estimated to be less thanKRW20bn, only about 10% of what the company earned in 1Q11 and 2Q11. We expect low synthetic rubber margins to improve, but the low operating rate of upstream naphthacracker would pose an upside risk to the raw material (BD) price, limiting rubber m
29、argin expansion. New capacities (SBR 110ktpa and SSBR 60ktpa) are scheduled to be operational in 4Q12, but itremains to be seen whether the new volumes can find buyers given the depressed end demand.3Korea Refining and ChemicalsChemicals/Refining9 October 2012Hanwha Chemical (009830 KS, UW(V), KRW20
30、,450, TP KRW18,200) Core chemical operations should improve marginally, but not significantly, mainly on inventory valuationgains. We estimate 3Q12 EBIT to be around cKRW73bn, KRW28bn higher than a quarter ago. Spot-to-spot margins are estimated to decrease, but earnings from the 50%-owned affiliate
31、 YeochonNCC (YNCC) should have improved on the reversal of one-off impairments in 2Q12. Solar businessshould improve with a smaller q-o-q loss on cost control, but we expect losses to last until end-2013,at the earliest. Increasing ethylene cost is a burden for Hanwha Chemical in 4Q12, as we think t
32、he ability to passthrough rising feedstock costs is limited. Therefore, we expect sequential weakness in 4Q12e earnings.Valuation and risks SK Innovation: We apply a 9x forward PE multiple, higher than the sectors historical average of8.3x considering the long-term growth potential, on next 12 month
33、s earnings. From this, we deriveour target price of KRW170,000. Under our research model, for stocks with a volatility indicator, theNeutral band is 10ppts above and below the hurdle rate for Korean stocks of 10.5%. Our target priceimplies a potential return of 8.2%, including the prospective divide
34、nd yield, which is within theNeutral band; therefore, we reiterate our Neutral (V) rating. Potential return equals the percentagedifference between the current share price and the target price, including the prospective dividend yield.Key upside risk is lube margin expansion, and key downside risk i
35、s a sharp fall in the crude oilprice that might cause an inventory write-off. GS Holdings: We use forward PE multiple to value GSH. We applied a 7.5x PE multiple on next 12-months earnings, which is a 10% discount to the sectors historical average, considering the holdingscompany structure. Under ou
36、r research model, for stocks with a volatility indicator, the Neutral bandis 10ppts above and below the hurdle rate for Korean stocks of 10.5%. At the time we set our targetprice, it implied a potential return that was above the Neutral band; therefore, we rate the sharesOverweight (V). Potential re
37、turn equals the percentage difference between the current share price andthe target price, including the prospective dividend yield. Key downside risk is a sharp fall in thecrude oil price that might cause an inventory write-off. LG Chemical: We use a sum-of-the-parts valuation methodology to value
38、LG Chem. We apply a6.5x EV/EBITDA target multiple (the mid-cycle average of the industry) to value the chemicalbusiness and for the I&E business, we apply a 7.7x EV/EBITDA target multiple. From this, wederive a target price of KRW410,000. Under our research model, for stocks with a volatilityindicat
39、or, the Neutral band is 10ppts above and below the hurdle rate for Korean stocks of 10.5%.Our target price implies a potential return of 26.1%, including the prospective dividend yield, whichis above the Neutral band; therefore, we rate the stock Overweight (V). Potential return equals thepercentage
40、 difference between the current share price and the target price, including the prospectivedividend yield. Key downside risk is a further delay in the start-up of the new IT businesses.4abcKorea Refining and ChemicalsChemicals/Refiningabc9 October 2012 Honam Petrochem: We use forward PB multiple met
41、hodology to value Honam Petrochem. Weapply target PB multiple of 1.2x on 12 months forward BVPS considering the medium-term (2012-14e) weighted average return on equity forecast of 10.6% and the structural tightness of the keyproduct, butadiene. From this, we derive a TP of KRW220,000. Under our res
42、earch model, for stockswith a volatility indicator, the Neutral band is 10ppts above and below the hurdle rate for Koreanstocks of 10.5%. Our target price implies a potential return including dividend yield of -9.2%, belowthe Neutral band; therefore, we reiterate our Underweight (V) rating. Potentia
43、l return equals thepercentage difference between the current share price and the target price, including the prospectivedividend yield. Key upside risk is a spike in butadiene price. Kumho Petrochem: We use a sum-of-the-parts valuation methodology to value Kumho Petrochem.We apply the sector histori
44、cal average EV/EBITDA multiple of 6.5x to the core chemical businessnormalised (2012-14e) EBITDA, and the affiliate companies are valued at 2.0 x (Kumho Polychem)and 0.7x (Kumho Mitsui Chem) PB, respectively. Holding securities are valued at market value.From this, we derive our target price of KRW1
45、30,000. Under our research model, for stocks with avolatility indicator, the Neutral band is 10ppts above and below the hurdle rate for Korean stocks of10.5%. Our target price implies a potential return including dividend yield of 13.3%, within theNeutral band; therefore, we reiterate our Neutral (V
46、) rating. Potential return equals the percentagedifference between the current share price and the target price, including the prospective dividendyield. Key upside risk is stronger-than-expected demand, and key downside risk is a spike in rawmaterial (butadiene) price. Hanwha Chemical: We use a sum
47、-of-the-parts methodology to value Hanwha Chem. For thebiosimilars business, we assign a value of cKRW650bn based on a DCF, incorporating a WACC of8.5% (unchanged). For the non-bio business, we continue to use a target PB multiple of 0.5x on2013e BVPS, 30% lower than the historical average of 0.72x
48、reflecting the 2012-13e average ROE ofc4% versus the long-term average of 6.0%. We deduct KRW311bn from this as we continue tobelieve the ongoing capex for the polysilicon plant will be value-destructive. From this, we derive ourtarget price of KRW18,200. Under our research model, for stocks with a
49、volatility indicator, theNeutral band is 10ppts above and below the hurdle rate for Korean stocks of 10.5%. Our target priceimplies a potential return including dividend yield of -8.8%, below the Neutral band; therefore, werate the stock Underweight (V). Potential return equals the percentage differ
50、ence between the currentshare price and the target price, including the prospective dividend yield. Key upside risk is anunexpected policy-driven recovery in solar demand.53Q12eJul121Q053Q051Q063Q061Q073Q071Q083Q081Q093Q091Q103Q101Q113Q111Q123Q12Jan-08Jan-09Jan-10Jan-11Jan-12Jan09Jan10Jan11Jan12Jul0
51、9Jul10Jul114Q12e1Q11 2Q11 3Q11 4Q11 1Q12 2Q12Korea Refining and ChemicalsChemicals/Refining9 October 2012Korea refining: 1Q11-4Q12e Quarterly OP vs consensusKorea chemicals: 1Q11-4Q12e Quarterly OP vs consensusabc2000150010005000-500LG ChemKumho Petrochem2013e consensus quarterly av gHonam Petrochem
52、Hanw ha ChemSource: Bloomberg, HSBC estimatesPeriod-end Dubai crude spot price (USD/bbl) and q-o-q %changeSource: Bloomberg, HSBC estimatesSG-Dubai complex GRM (USD/bbl)150100500Dubai crude spot60%40%20%0%-20%-40%-60%-80%QoQ % chg (RHS)141210864202004 2005 2006 2007 2008 2009 2010 2011 2012 2013Sour
53、ce: Bloomberg, HSBCBD-integrated naphtha cracker margin per tonne of ethyleneproduction (USD/t)1,0008006004002000Source: Thompson Reuters Datastream, HSBCUS Lube Base Oil gross margins (USD/t)1,5001,000500-6Naphtha based cracker marginSource: IHS Chemical, Bloomberg, Thompson Reuters Datastream, HSB
54、C estimatesSource: LNG, HSBCGroup IIGroup IIIKorea Refining and ChemicalsChemicals/Refining9 October 2012Financials & valuation: SK InnovationFinancial statementsValuation dataabcNeutral (V)Year to12/2011a12/2012e12/2013e12/2014eYear to12/2011a12/2012e12/2013e12/2014eProfit & loss summary (KRWb)Reve
55、nueEBITDADepreciation & amortisationOperating profit/EBITNet interestPBTHSBC PBTTaxationNet profitHSBC net profit68,3713,448-6052,842-2724,3094,309-1,1333,1653,16567,3642,795-5592,236-2712,3412,341-7521,5791,57955,8503,171-6152,556-2712,6052,605-6611,9341,93458,5933,165-6742,491-2712,4792,479-6091,8
56、611,861EV/sales 0.3EV/EBITDA 5.5EV/IC 1.0PE* 4.7P/Book value 1.0FCF yield (%) 6.3Dividend yield (%) 1.8Note: * = Based on HSBC EPS (fully diluted)Issuer information0.36.81.09.30.93.51.60.35.70.97.60.810.01.60.35.70.87.90.83.01.6Cash flow summary (KRWb)Cash flow from operationsCapexCash flow from inv
57、estmentDividendsChange in net debtFCF equity2,722-1,106814-199-1,9819252,254-1,400-2,000-234-195153,459-1,700-2,400-234-8251,4722,306-1,600-2,000-234-72446Share (KRW)159,500priceReuters (Equity) 096770.KSMarket cap (USDm) 13,306Free float (%) 59Country KoreaAnalyst Dennis YooTarget price (KRW)170,00
58、0Bloomberg (Equity) 096770 KSMarket cap (KRWb) 14,748Enterprise value (KRWb) 19015Sector Oil & GasContact +852 2996 69176.6Balance sheet summary (KRWb)Intangible fixed assetsTangible fixed assetsCurrent assetsCash & othersTotal assetsOperating liabilitiesGross debtNet debtShareholders fundsInvested
59、capital1,20612,99419,8874,56735,02711,3428,8534,28614,57718,1771,22814,41319,6914,57136,27211,2858,8384,26715,88719,4751,24216,18317,5724,73635,9389,9358,1783,44217,55720,3271,24917,50218,1314,75037,82210,2408,1213,37019,18621,891Price relative25748723748721748719748717748715748713748711748797487774
60、872574872374872174871974871774871574871374871174879748777487Ratio, growth and per share analysis2010SK Innovation2011Rel to KOSPI INDEX20122013Year to12/2011a12/2012e12/2013e12/2014eSource: HSBCY-o-y % changeNote: price at close of 08 Oct 2012RevenueEBITDAOperating profitPBTHSBC EPS55.957.865.8190.9
61、164.0-1.5-18.9-21.3-45.7-50.1-17.113.514.311.322.54.9-0.2-2.6-4.8-3.8Ratios (%)Revenue/IC (x)ROICROEROAEBITDA marginOperating profit marginEBITDA/net interest (x)Net debt/equityNet debt/EBITDA (x)CF from operations/net debt3.912.025.011.35.04.212.729.41.263.53.68.110.44.54.13.310.326.91.552.82.89.61
62、1.65.45.74.611.719.61.1100.52.88.910.15.15.44.311.717.61.168.4Per share data (KRW)EPS Rep (fully diluted)HSBC EPS (fully diluted)DPSBook value34233.8234233.822800.00157650.9317077.4817077.482500.00171816.6220919.7920919.792500.00189875.1720123.2220123.222500.00207498.397Korea Refining and ChemicalsC
63、hemicals/Refining9 October 2012Financials & valuation: GS HoldingsFinancial statementsValuation dataabcOverweight (V)Year to12/2011a12/2012e12/2013e12/2014eYear to12/2011a12/2012e12/2013e12/2014eProfit & loss summary (KRWb)RevenueEBITDADepreciation & amortisationOperating profit/EBITNet interestPBTH
64、SBC PBTTaxationNet profitHSBC net profit8,4931,094-1649300893893-8377177110,6361,073-1748980867867-11868168113,0771,313-1681,14601,1151,115-17286886814,5581,220-1611,05901,0281,028-193750750EV/sales 1.0EV/EBITDA 7.6EV/IC 0.9PE* 7.7P/Book value 1.0FCF yield (%) 5.7Dividend yield (%) 2.1Note: * = Base
65、d on HSBC EPS (fully diluted)Issuer information0.88.00.98.80.99.32.60.76.50.86.90.815.82.60.66.90.78.00.813.92.6Cash flow summary (KRWb)Cash flow from operationsCapexCash flow from investmentDividendsChange in net debtFCF equity186-672-526-1421,698339363-400-500-156294555440-200-300-15617941557-200-
66、300-156-101828Share (KRW)64,300priceReuters (Equity) 078930.KSMarket cap (USDm) 5,390Free float (%) 48Country KoreaAnalyst Dennis YooTarget price (KRW)75,500Bloomberg (Equity) 078930 KSMarket cap (KRWb) 5,974Enterprise value (KRWb) 8557Sector OIL & GASContact +852 2996 691717.4Balance sheet summary (KRWb)Intangible fixed assetsTangible fixed assetsCurrent assetsCash & othersTotal assetsOperating liabilitiesGross debtNet debtShareholders fundsInvested capital1,0827,3511,99222910,4251,1182,5182,28
- 温馨提示:
1: 本站所有资源如无特殊说明,都需要本地电脑安装OFFICE2007和PDF阅读器。图纸软件为CAD,CAXA,PROE,UG,SolidWorks等.压缩文件请下载最新的WinRAR软件解压。
2: 本站的文档不包含任何第三方提供的附件图纸等,如果需要附件,请联系上传者。文件的所有权益归上传用户所有。
3.本站RAR压缩包中若带图纸,网页内容里面会有图纸预览,若没有图纸预览就没有图纸。
4. 未经权益所有人同意不得将文件中的内容挪作商业或盈利用途。
5. 装配图网仅提供信息存储空间,仅对用户上传内容的表现方式做保护处理,对用户上传分享的文档内容本身不做任何修改或编辑,并不能对任何下载内容负责。
6. 下载文件中如有侵权或不适当内容,请与我们联系,我们立即纠正。
7. 本站不保证下载资源的准确性、安全性和完整性, 同时也不承担用户因使用这些下载资源对自己和他人造成任何形式的伤害或损失。
