 全球经济周评:日本走出流动性陷阱的市场影响130207

《全球经济周评:日本走出流动性陷阱的市场影响130207》由会员分享,可在线阅读,更多相关《全球经济周评:日本走出流动性陷阱的市场影响130207(14页珍藏版)》请在装配图网上搜索。
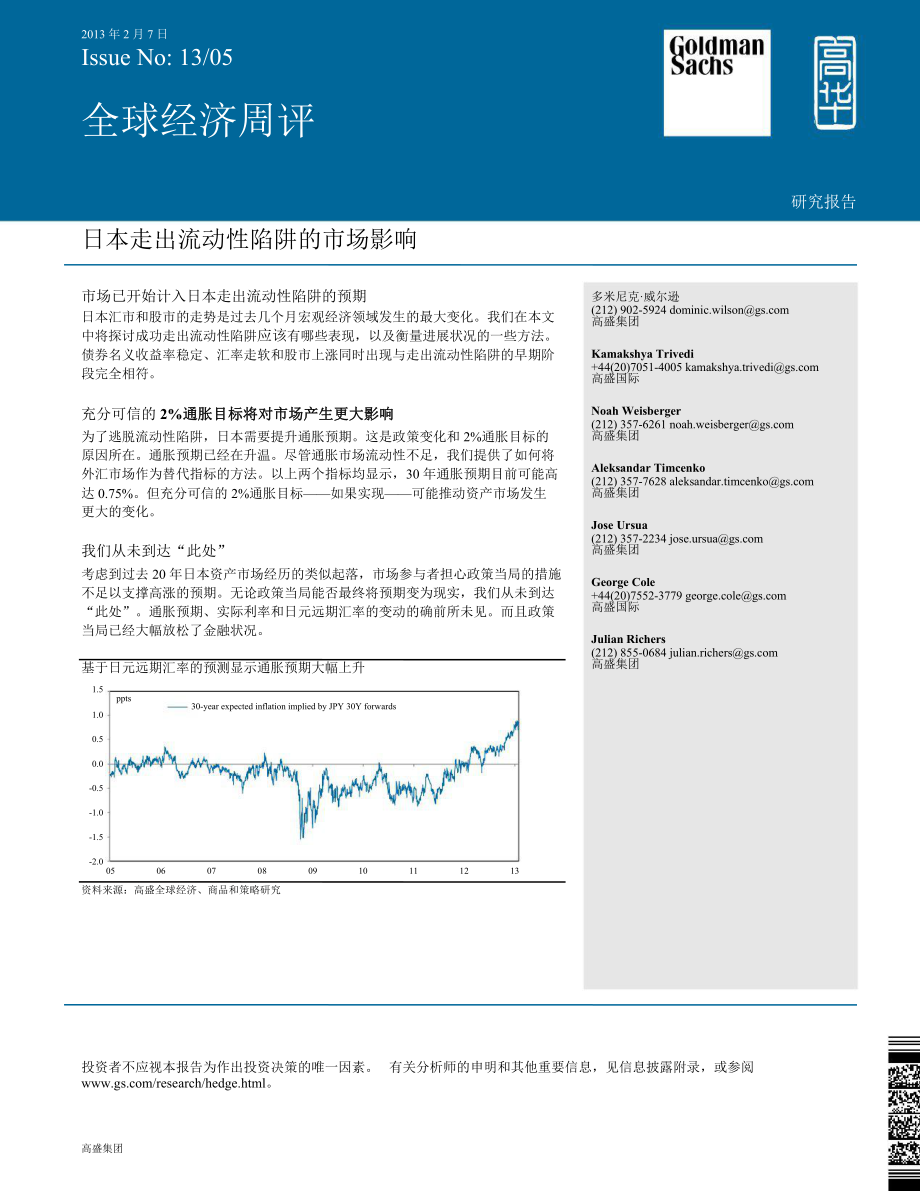
1、2013 年 2 月 7 日Issue No: 13/05全球经济周评研究报告日本走出流动性陷阱的市场影响市场已开始计入日本走出流动性陷阱的预期日本汇市和股市的走势是过去几个月宏观经济领域发生的最大变化。我们在本文中将探讨成功走出流动性陷阱应该有哪些表现,以及衡量进展状况的一些方法。债券名义收益率稳定、汇率走软和股市上涨同时出现与走出流动性陷阱的早期阶段完全相符。充分可信的 2%通胀目标将对市场产生更大影响通胀目标将对市场产生更大影响为了逃脱流动性陷阱,日本需要提升通胀预期。这是政策变化和 2%通胀目标的原因所在。通胀预期已经在升温。尽管通胀市场流动性不足,我们提供了如何将外汇市场作为替代指标
2、的方法。以上两个指标均显示,30 年通胀预期目前可能高达 0.75%。但充分可信的 2%通胀目标如果实现可能推动资产市场发生更大的变化。我们从未到达“此处”考虑到过去 20 年日本资产市场经历的类似起落,市场参与者担心政策当局的措施不足以支撑高涨的预期。无论政策当局能否最终将预期变为现实,我们从未到达“此处”。通胀预期、实际利率和日元远期汇率的变动的确前所未见。而且政策当局已经大幅放松了金融状况。基于日元远期汇率的预测显示通胀预期大幅上升多米尼克威尔逊(212) 902-5924 高盛集团Kamakshya Trivedi+44(20)7051-4005 高盛国际Noah Weisberger
3、(212) 357-6261 高盛集团Aleksandar Timcenko(212) 357-7628 高盛集团Jose Ursua(212) 357-2234 高盛集团George Cole+44(20)7552-3779 高盛国际Julian Richers(212) 855-0684 高盛集团1.51.00.50.0-0.5-1.0-1.5-2.0ppts30-year expected inflation implied by JPY 30Y forwards050607080910111213资料来源:高盛全球经济、商品和策略研究投资者不应视本报告为作出投资决策的唯一因素。 有关分
4、析师的申明和其他重要信息,见信息披露附录,或参阅 年 2 月 7 日Global Economics WeeklyThe market consequences of exiting Japans liquidity trapThe moves in Japanese currency and equity markets have been the single biggest change in themacro landscape over the last few months. Markets have clearly responded to shifts in theJapane
5、se monetary policy framework and are anticipating further shifts ahead.Judging the opportunities from here requires two things:First, a view on how policy is likely to change; Naohiko Baba and our Japan Economicsteam have laid out the possible options for monetary policy in the months ahead, andcont
6、inue to discuss and monitor the operational challenges for delivering fresh easing(see Japan Economics Analyst 13/01, for example).Second, a view on the shifts that markets are already expecting. That task iscomplicated by the counterintuitive nature of how markets behave in liquidity traps. Toescap
7、e the trap, Japan needs to raise inflation expectations to lower real rates, sincenominal rates cannot be lowered. That is the logic behind the shift in monetary policyand a 2% inflation target.We look here at what a successful exit from the liquidity trap should look like and some simpleways to mon
8、itor and benchmark progress towards that. The combination of stable nominal bondyields, a weakening currency and rising equities is fully consistent with the start of that process.The decline in real rates and the rise in inflation expectationswhich we also extract from long-dated currency forwardsd
9、efy the notion that we have seen this all before. Whetherpolicymakers ultimately succeed in validating expectations, the shift in markets on this front isgenuinely new. But a fully credible 2% inflation targetif it can ever be achievedwouldpotentially involve much larger shifts.Liquidity trapsGinza
10、styleLiquidity trapsthe point at which conventional monetary policy becomes ineffective becausenominal interest rates fall below zerohave become a common feature of the landscape in the US,UK and other major economies. But Japan remains the archetype, and a cautionary tale. It is thefirst case in mo
11、dern historyand so the longest-lastingof an economy coming hard up against thezero bound. But it is also the only case so far where a slide into deflation has meant that real interestrates (the nominal rate less expected inflation) are positive even with rates at zero. Unlike the US,where the market
12、 still prices an eventual exit, Japanese rates markets have long priced policy to bestuck effectively at zero into the indefinite future. As a result, unlike the US, the ability to influenceeven long-term nominal interest rates through asset purchases has largely been exhausted. Raisinginflation exp
13、ectations is the only plausible channel to shift the real rate structure.While Japan first slid into deflation 15 years ago, the constraints of the liquidity trap intensifiedwith the 2008 financial crisis. The classic symptoms of a liquidity trapreal rates that are too highand a real exchange rate t
14、hat is too stronghave been starkly visible since then. Where the Fedoffset deflationary pressures through sharp falls in long-term nominal and real interest rates,Japans long-term real interest rates rose through the crisis and stayed above pre-crisis levelsfrom mid-2008 through 2012 (Exhibit 1). Th
15、e impact was compounded by the sharp reductions ininterest rates in the US and elsewhere. The real interest rate differential between the US andJapan swung from positive to negative in late 2008 and moved further as the Fedsunconventional policies lowered US real rates further in 2011, without a suf
16、ficiently aggressiveoffsetting BoJ response. As a result, the JPY strengthened during the crisis and strengthenedmore through the recovery (Exhibit 2).高盛全球经济、商品和策略研究541132013 年 2 月 7 日Exhibit 1: Japanese real rates higher post-crisis, even asUS rates fellGlobal Economics WeeklyExhibit 2: A narrowing
17、 real rate differential pushed theJPY strongerpptsJapan 10Y real rateUS 10Y real rate2.01.5%US-Japan 10-year real rate differentialJPY (RHS)1301203210-11.00.50.0-0.5-1.0-1.5-2.01101009080706005060708091011121307080910111213Source: GS Global ECS Research.Source: GS Global ECS Research.Japanlike most
18、other countrieshas many problems besides monetary policy. But an overlytight (real) monetary policy has been the dominant macro problem of recent years. At its simplest,much of the strength of the JPY and weakness in Japanese asset markets over this period can betraced to this source. Even counting
19、the recent shifts, the JPY remains 24% stronger against theUSD than in January 2007 and Japanese stocks are 35% weaker, the worst performer of themajor markets (including a crisis-affected Euro area).What a liquidity trap exit should look like in asset marketsBeyond the question of whether Japanese
20、policymakers achieve success, a good anchoring pointis to look at what a complete exit from a deep liquidity trap like Japans would look like acrossasset markets. As an economy moves into a liquidity trap, nominal rates become unable to fallbelow the zero bound. The result is that real rates remain
21、above where they would naturally beand the real (and nominal) exchange rate tends to be stronger than it would otherwise be. As aresult, local asset markets are also weaker than otherwise, reflecting an excessively high realinterest rate structure.A successful exit essentially involves the reversal
22、of these asset market effects. With little scopeto lower nominal interest rates, the only way to push real interest rates lower is to raise inflationexpectations. Precisely because the economy is in a liquidity trap, real rates are higher than theywould be without the zero bound, so rising inflation
23、 expectations would not be expected to raisenominal interest rates, at least over the zone in which the liquidity trap was binding. So, the mainshifts should involve a downward shift in the real rate curve, not an upward shift in the nominalrate curve.As a result of falling real rates, equities and
24、other local assets should rise. The currency shouldalso weaken. Because the shift in interest rate markets should push real rates lower while leavingnominal rates stable, the weakness in the spot currency rate should be accompanied by anequivalent shift in long-dated currency forwards. This, we shal
25、l see, is an important andunderappreciated feature of a liquidity trap exit. And it means that stable nominal interest ratedifferentials alongside a depreciating currency are not an anomaly, but the exact combination youshould expect to see from a successful liquidity trap exit.If the market came to
26、 believe in a successful exit, it is possible that very long-dated nominal rates might rise, sincethe pricing at very long horizons is less likely to be deeply trapped than at short horizons.高盛全球经济、商品和策略研究42013 年 2 月 7 日Exhibit 3: Inflation swaps show rising inflationexpectations since late 2011Glob
27、al Economics WeeklyExhibit 4: The JPY 30 years forward has broken out of itsold range1.51.00.50.0-0.5-1.0-1.5-2.0-2.5-3.0ppts10Y inflation swap rate20Y inflation swap rate30Y inflation swap rate75706560555045403530JPY, 30Y forward0809101112020304050607080910111213Source: GS Global ECS Research.Sourc
28、e: GS Global ECS Research.Japanese asset markets consistent with a monetary policy shiftHow does this compare to what we see? The two most obvious aspects of the shift are easilyvisible: a sharp rise in equity markets and a sharp decline in the JPY. What is also striking is thatJapanese bond markets
29、 have been remarkably stable. Japanese nominal bond yields have fallenat the front of the yield curve and may already have shifted to price duration extension in assetpurchases from 3 to 5 years and a cut in interest on excess reserves. At the 30-year point, therehas been a mild increase in yields o
30、ver the last 6 months, but less than the equivalent rise in theUS. Some modest steepening in the back end of the curve is in any case consistent with thetemplate we just described.Measures of real interest rates have fallen sharply. Inflation swap markets show a significant rise ininflation expectat
31、ions at all horizons: 10- and 30-year inflation swaps have moved from pricingpersistent deflation to pricing positive inflation (of around 0.7%), and breakeven rates from index-linked Japanese bonds tell a similar story (Exhibit 3). The rise in inflation views seems to haveoccurred in two main steps
32、: one in late 2011/early 2012 and another in the last few months. Theresult is that 5-year market measures of real interest rates have finally turned firmly negative andlonger-dated measures of real rates have fallen to around their lowest levels on record. At the sametime, Exhibit 4 shows that the
33、sharp depreciation in the spot level of the JPY has been matched byan equally sharp decline in where the JPY will trade 30 years forward, breaking out of the range ofthe last decade (excluding a brief temporary spasm during the depth of the 2008 crisis). As a result,the tight link between the JPY an
34、d nominal interest rate differentials has broken down, as it should.Whether or not it is ultimately justified, the broad picture across markets is very consistent withthe belief that something is changing in the conduct of monetary policy.Using FX markets to track inflation expectationsThe ability t
35、o measure inflation expectations is critical to tracking the progress and success of anexit policy in a deep liquidity trap such as Japans. Both index-linked markets and inflation swapsexist in Japan and have been used in calculating the real interest rates shown already. But thosemarkets are a lot
36、less liquid than in the US, so the risk that they are not truly representative of高盛全球经济、商品和策略研究52013 年 2 月 7 日Global Economics Weeklymarket views or are dominated by particular hedging needs is always a concern. Surveyexpectations are another potential source of information and any sustained increas
37、e in inflationexpectations will need to shift views there. But those measures may be much slower to movethan the markets view. Fortunately, as suggested above, FX markets offer another cross-check(see the Box on page 7). At very long horizons, the forward USD/JPY exchange rate can beviewed as a refl
38、ection of the price level expected at that date relative to the price level expected inthe US. Long-dated forward FX markets are not highly liquid either. But the spot and interest ratemarkets that pin them down are liquid, so the price signals here may still be quite reliable. What isremarkable loo
39、king at the 30-year forward USD/JPY rate is how stable that rate was over much ofthe last decade. In fact, decomposing the appreciation in the JPY from the start of 2007, theentire appreciation to the lows in late 2011/early 2012 came without any shift in the 30-yearforward currency rate (Exhibit 5)
40、. The entire shift in $/JPY could be explained by the decline in USinterest rate differentials to Japan.Since early 2012, the exact opposite has been true. The entire depreciation has been driven byshifts in the 30-year JPY forward rate, with no role played by interest rate differentials. Thissuppor
41、ts the notion that over the last year, views of the future price level (and implicitly long-runinflation views) have begun to shift seriously for the first time in many years. That regime shiftreflects the same important shift seen in inflation markets. We can use 30-year JPY forwards,nominal intere
42、st rates and US inflation breakevens to generate an estimate of how Japaneseinflation expectations have changed over time. Exhibit 6 does exactly this. It shows that afterfalling sharply during the 2008 financial crisis, expectations of modest deflation may have set inthrough much of 2009-2011 (an e
43、ven gloomier picture than the inflation swap market may havepriced).Since then, there has been a dramatic shift, with a leg higher in late 2011/early 2012 and anothershift higher since October 2012. The first rise occurs during the period of JPY intervention and theshift to a 1% inflation goal in Fe
44、bruary 2012. The second rise clearly matches the timing of theshift towards a 2% inflation target led by Prime Minster Abe. On this benchmark, 30-year inflationexpectations could now be as high as 0.75%, a similar message to inflation swap markets. Whilethe exact benchmarking here cannot be taken to
45、o precisely, the story is the same. Japaneseinflation expectations appear to have seen a major shift higher, alongside an equally large drop inreal interest rates.Exhibit 5: JPY drivers shift from interest rate differentialto forward JPY rate in recent monthsExhibit 6: Inflation estimates from JPY f
46、orwards show asharp rise in expectations too3020Change in JPY level from Jan 1, 20071.51.0ppts30-year expected inflationimplied by JPY 30Y forwards100.500.0-10-0.5-20-30-1.0-40-50JPY, 30Y forwardJPY spot-1.5-2.007080910111213050607080910111213Source: GS Global ECS Research.高盛全球经济、商品和策略研究Source: GS G
47、lobal ECS Research. See text for details.62013 年 2 月 7 日Global Economics WeeklyWhat a credible 2% inflation target would mean for assetsAlthough these areas imply a significant shift in inflation expectations, they also suggest that acredible commitment to 2% inflation is not yet close to being pric
48、ed. What would asset marketslook like if it were?Any attempt to analyse this is necessarily stylised, but helps to elucidate the main determinants.The key starting point is to think about the interest rate structure. Recall that the critical issue withthe liquidity trap is that real rates are higher
49、 than they should be. As a result, inflationexpectations can in principle rise without nominal rates rising, up to the point at which the realrate structure is appropriate again for the state of the economy and policy settings. At that point,the liquidity trap would cease to bind and raising inflati
50、on expectations further would push nominalrates higher (although by escaping the liquidity trap, the capacity of policy to limit those rateincreases would also be enhanced).Defining what the Japanese real rate curve should look like without the constraint of the zerobound (or the equilibrium real in
51、terest rate) lies beyond the scope of our analysis.But the US provides one possible template of what another developed economy has been able todeliver: deeply negative real yields at the front end of the curve, with the instantaneous forwardrate turning positive in 5-6 years time. We can look at wha
52、t would happen to Japanese nominalrates if they priced something like the US real rate structure alongside a shift to 2% inflation overthe next five years and beyond. Exhibit 9 shows the results. Real rates would fall further,especially at the front end of the yield curve, and the nominal curve may
53、actually flatten out to 7years. Implied yields would then be higher beyond that point compared with where they are now.The shift in nominal interest rates envisaged here, however, would be quite modest even at the30-year horizonaround 40bp. The main shift would still come from significantly lower re
54、al rates.To look at the accompanying FX moves, we can use the same framework that allows us to backout inflation expectations from the currency forwards. All else equal, if the market priced a 2%inflation target on a sustained basis, the 30-year JPY forward would be estimated to move toaround 80 (fr
55、om 62 currently). Assuming constant US interest rates and the assumptions aboveon nominal 30-year rates (a modest rise), this yields a spot JPY rate of around 115 (Exhibit 10).Of course, if US rates rose relative to Japanese rates over that periodas our forecastsenvisagethe JPY spot rates consistent
56、 with a fully credible target could move much higher still.The JPY TWI would likely follow a similar path. While a JPY rate of 115 seems some way offcurrent levels, analysis by our Japan Economics team has shown that it will be difficult to delivercore CPI inflation of even 1% without the JPY weaken
57、ing to these types of levels.Translating these shifts into equities cannot be done so directly. But the tight correlations betweenJapanese stock markets, the JPY and Japanese real rates in the last 7-8 years suggests that theyhave increasingly shared the same drivers over this period, even if it is
58、wrong to view either ascausing the other. We can use those relationships and our estimates of where the JPY and realrates might belong to make a simple prediction for where local equity markets might trade. Simplemodels of this kind generally put the Nikkei at around 14,250, although there is clearl
59、y sensitivityto the period and method applied. Kathy Matsuis modelling of earnings sensitivity to the JPYwould imply equity index levels that are slightly lower levels but in the same ballpark (see Japan:Portfolio Strategy: Abe-nomics: Raising Topix target to 1100, January 23, 2013).高盛全球经济、商品和策略研究No
60、minalinterestratedifferentialsstayconstantgiven“liquiditytrap”NominalinterestratedifferentialsnarrowonhigherinflationexpectationsForwardJPYweakensonhigherexpectedpricelevelForwardJPYweakensonhigherexpectedpricelevel72013 年 2 月 7 日Backing out the price level from FX forwardsGlobal Economics WeeklyEco
61、nomistsand many empirical economic modelsoftenthink of the long-run real exchange rate as being pinneddown by deep structural fundamentals. The long-run nominalexchange rate is then determined by the long-run realexchange rate and the relative price levels of the twocountries. All else equal, if peo
62、ple expected the price level inJapan in 30 years to be 30% higher, this should be reflectedby a depreciation of 30% in the 30-year forward JPY currencyrate. Covered interest parity then means that the current spotexchange rate is determined by that forward long-runexchange rate and interest rate dif
63、ferentials.Real exchange rate expectations at very long horizonsshould not be as sensitive to cyclical and other fluctuationsas exchange rates on shorter horizons. Exhibit 5 showed thatdespite the large moves in $/JPY spot rates over the lastdecade, $/JPY rates 30 years forward were much morestable.
64、 If we are prepared to assume that the long-run realexchange rate is broadly stableand that shifts in forwardrisk premia are toothen shifts in the 30-year forward ratewill primarily reflect shifts in relative views of the US andJapanese price level, and so of the inflation rates expectedover the nex
65、t 30 years. This is true regardless of whether theeconomy is in a liquidity trap or not. What is different in aliquidity trap is the impact on spot exchange rates. Withoutthe liquidity trap, an increase in expected inflation in Japanwould translate into a higher future price level (and weakerforward
66、 exchange rate, a shift from point A to point B inExhibit 7) and into higher nominal interest rates. As a result,while the forward exchange rate would weaken, interest ratedifferentials would narrow in Japans favour, offsetting thatimpact on the spot rate. In a liquidity trap, the forwardexchangeExhibit 7: Without liquidity trap, forward JPY moves withhigher inflation viewExchange raterate would again weaken on expectations of a higher pricelevel. But because nominal interest rates would not ris
- 温馨提示:
1: 本站所有资源如无特殊说明,都需要本地电脑安装OFFICE2007和PDF阅读器。图纸软件为CAD,CAXA,PROE,UG,SolidWorks等.压缩文件请下载最新的WinRAR软件解压。
2: 本站的文档不包含任何第三方提供的附件图纸等,如果需要附件,请联系上传者。文件的所有权益归上传用户所有。
3.本站RAR压缩包中若带图纸,网页内容里面会有图纸预览,若没有图纸预览就没有图纸。
4. 未经权益所有人同意不得将文件中的内容挪作商业或盈利用途。
5. 装配图网仅提供信息存储空间,仅对用户上传内容的表现方式做保护处理,对用户上传分享的文档内容本身不做任何修改或编辑,并不能对任何下载内容负责。
6. 下载文件中如有侵权或不适当内容,请与我们联系,我们立即纠正。
7. 本站不保证下载资源的准确性、安全性和完整性, 同时也不承担用户因使用这些下载资源对自己和他人造成任何形式的伤害或损失。
![SUNVER6[1].0X用户手册](/Images/s.gif)