 某咨询-化学行业分析报告


《某咨询-化学行业分析报告》由会员分享,可在线阅读,更多相关《某咨询-化学行业分析报告(34页珍藏版)》请在装配图网上搜索。
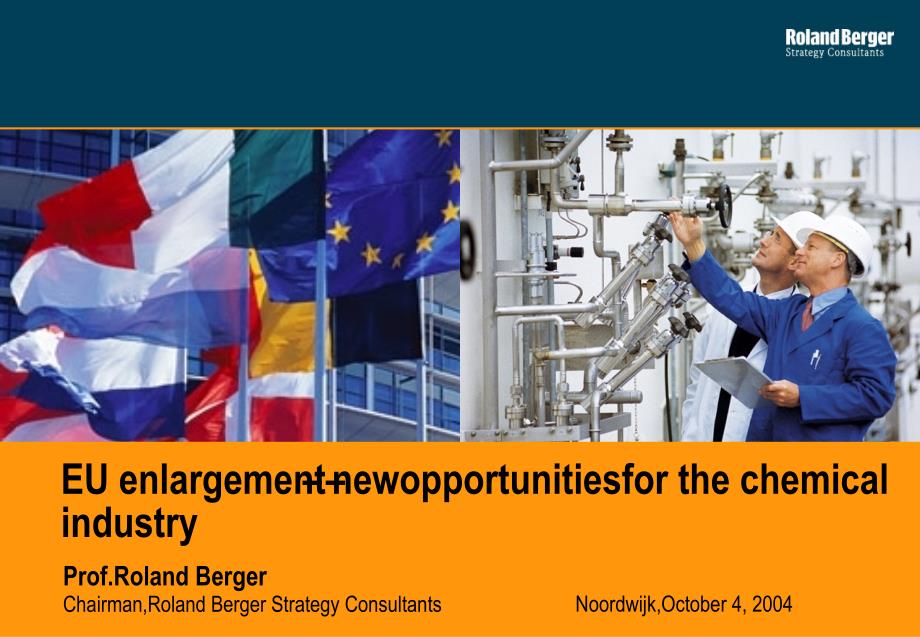
1、0,I,Click to edit Master text styles,Second level,Third level,Fourth level,Click to edit Master title style,Noordwijk,October 4,2004,Prof.Roland Berger,Chairman,Roland Berger Strategy Consultants,EU enlargement,newopportunitiesfor the chemical industry,The changing face ofEurope,Challengesandopportu
2、nities of enlargement for EU15,Opportunities for EU,15,chemical players inCEE and CIS,Conclusion,Contents,A.,The changing face ofEurope,%ofEU 25,France,Germany,Italy and Benelux:Six wealthy core countries start economic integration process in1957,1.1,EU 6(1957),*,*2003 data,Europescorecountrieshadsl
3、uggish growthoverthelastten years:Average growth1.3%p.a.in Germany,1.7%in France,2.5%Netherlands,GDP/capita USD,28,608,118.0%,75.5%,%ofUS,Population m,227,50.0%,78.0%,GDP USD bn,6,494,58.9%,59.0%,Denmark,Ireland andtheUnited Kingdom:Firstacces-sion round after 16 years increases economic power,1.2,E
4、U 9(1973)*,*2003 data,Asa result of EUintegration,Irelands economic growth has been out-standingly high over the past tenyears:7.6%p.a.(DK 2.1%,UK2.8%),Population m,297,65.0%,102.0%,GDP/capita USD,29,141,120.2%,76.9%,GDP USD bn,8,655,78.5%,78.8%,%ofEU 25,%ofUS,Greece:A poorer country joins the Europ
5、eanUnion in1981,first discussionsaboutdilution,1.3,EU 10(1981)*,*2003 data,Greece now has high averagegrowth rates(3.8%p.a.from 1995-2004),partly due toEuropeanmoneyfromstructural/regional funds,GDP USD bn,8,827,80.0%,80.3%,Population m,308,67.7%,106.2%,GDP/capita USD,28,659,118.3%,75.6%,%ofEU 25,%o
6、fUS,SpainandPortugal:Accessionof two less developed southern countries reducesEUsaverage wealth,1.4,EU12(1986)*,*2003data,Today,thesoutherncountriescontributetoEUgrowth:Spain(3.3%p.a.since1995)andPortugal(2.4%p.a.)achievedhighaveragegrowthrates,GDPUSDbn,9,816,89.0%,89.3%,Population m,359,78.9%,123.0
7、%,112.8%,72.2%,GDP/capita USD,27,343,%ofEU25,%ofUS,Sweden,FinlandandAustria:EuropesnorthernenlargementpushesuptheaverageGDPpercapita,1.5,EU15(1995)*,*2003data,StimulustoEUgrowthoverthepasttenyears:Finlandseconomygrew3.5%p.a.onaverage,Swedens2.7%p.a.,andAustrias2.0%p.a.,GDPUSDbn,10,534,95.5%,95.9%,Po
8、pulation m,381,83.7%,130.5%,GDP/capita USD,27,648,114.1%,73.0%,%ofEU25,%ofUS,GDP USD bn,11,028,100.4%,Population m,455,156.0%,EasternEurope,MaltaandCyprus:ThebiggestroundofenlargementeverchangesthefaceofEurope,1.2,EU25(2004),*,*2003data,GDPgrowthratesofupto6.5%p.a.inCEE(average4.4%p.a.since95),But:E
9、nlargementisabigchallengeforEurope,an,Uniontocreatewealth,GDP/capita USD,24,237,64.0%,%ofUS,50yearsofenlargement:ComparedtotheUS,theEUhasgainedsizeattheexpenseofaveragewealth,Today,EuropesGDPpercapitaisonlyabouttwo-thirdsthatoftheUS,intermsoftotalGDP,botheconomiesarenowcomparable,EUvs.US*,US=100%,59
10、.0,77.5,80.3,89.3,95.9,100.4,78.0,102.0,106.2,123.8,130.5,156.0,75.5,76.9,75.6,72.2,73.0,64.0,1957,EU6,1973,EU9,1981,EU10,1986,EU12,1995,EU15,2004,EU25,GDP,Inhabitants,GDPpercapita,US=100,*basedon2003data,1.3,Wealthgap:Tenyearsago,thenorthoftheEuropeanUnionwasrichandthesouthwaspoor,2.1,Southgainedwe
11、althin,EU:From,34.4%ofEU-9(1986)to59.8%today,1995:Gapbetweennorthandsouth*,1995,*2003 data,*EU 12*Portugal,Spain,Greece,GDPUSDbn,Unemployment%,Populationm,SOUTH*,NORTH*,1,161,9,373,13.4,9.2,62,319,RATIO,9:1,GDPpercapitaUSD,18,726,29,383,3:2,2:3,5:1,7,429,27,620,4:1,Today,thegapis between eastandwest
12、,GDP per capita intheEU15 is four timeshigherthaninEU 10,2.2,2004:Gap between east and west,EU support willhelpEU10 e,conomic,developmentto reachEU15 wealth,2003,EU 10,EU 15,493,10,534,10.5,8.5,74,381,RATIO,21:1,4:5,5:1,GDPUSDbn,Unemployment%,Populationm,GDPpercapitaUSD,EU 25 vs.USvs.Asia:EnlargedEU
13、is astill powerful,buttheslowestgrowingeconomic regionintheworld,3.,Opportunity:Ten new states give the EU momentum to increase growth,ECONOMICPOWER,GDP,USD bn,Comparativeindicators 2003,POPULATION m,WEALTH GDPpercapita,USD,GROWTHavg.GDP growth1999-2003,%,10,988,290,3.3,11,028,455,2.3,US,EU 25,ASIA*
14、,*,Aggregated dataforJapan,China,ASEAN,8,458,1,947,4.8,37,890,24,237,12,058,B.,Challenges and opportunitiesofenlargementforEU 15,Eastwardenlargemententailsthreatsandopportunitiesforeconomies,companies,and governments,Economies,Unitlabor costadvantages in EU10,challenge existing valuecreation structu
15、resinEU 15,but also offer,momentumforstructuralchange/innovationin EU 15,Companies,Competition,in EU 15aswellasin EU 10,is increasing,but alsonew,sales,investment,growth and relocationopportunities,forEU 15 companiesin Eastern Europe,Governments,Existing,institutional setupsinEU 15 are challenged,by
16、 lowertaxes/contributions and higher flexibility inEU10,butalso,momentumforpolitical change,Effects ofenlargement,on,macroeconomic,and,microeconomic levels,Macroeconomic threats:PressureonEU 15 labormarketsandcompetitionforbestinstitutional setup,Lowwage-competition/unemploymentthreats,Migration,(upto,3.8m,people fromCEEwillmove totheEU15),Offshoring,(e.g.,830,000people,in CEE employedby German firmsin 2004),Lowtax/socialcontributions competition,Also:,Lessregulation,(e.g.IMD bureaucracy index:E
- 温馨提示:
1: 本站所有资源如无特殊说明,都需要本地电脑安装OFFICE2007和PDF阅读器。图纸软件为CAD,CAXA,PROE,UG,SolidWorks等.压缩文件请下载最新的WinRAR软件解压。
2: 本站的文档不包含任何第三方提供的附件图纸等,如果需要附件,请联系上传者。文件的所有权益归上传用户所有。
3.本站RAR压缩包中若带图纸,网页内容里面会有图纸预览,若没有图纸预览就没有图纸。
4. 未经权益所有人同意不得将文件中的内容挪作商业或盈利用途。
5. 装配图网仅提供信息存储空间,仅对用户上传内容的表现方式做保护处理,对用户上传分享的文档内容本身不做任何修改或编辑,并不能对任何下载内容负责。
6. 下载文件中如有侵权或不适当内容,请与我们联系,我们立即纠正。
7. 本站不保证下载资源的准确性、安全性和完整性, 同时也不承担用户因使用这些下载资源对自己和他人造成任何形式的伤害或损失。
