 大学英语六级图表作文写作

《大学英语六级图表作文写作》由会员分享,可在线阅读,更多相关《大学英语六级图表作文写作(19页珍藏版)》请在装配图网上搜索。
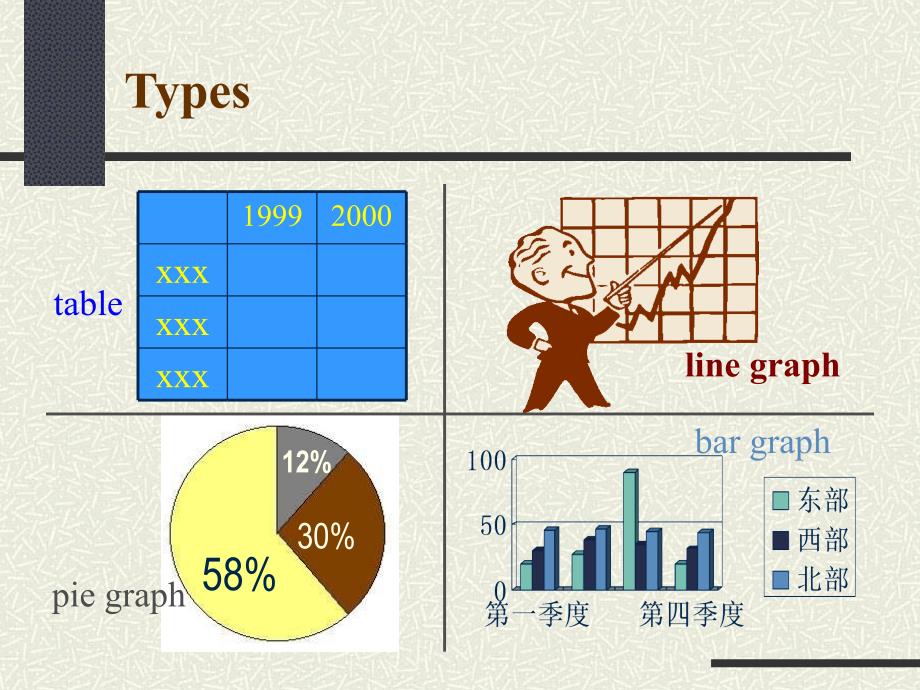
1、单击此处编辑母版标题样式,单击此处编辑母版文本样式,第二级,第三级,第四级,第五级,*,Types,58%,30%,12%,1999,2000,xxx,xxx,xxx,table,pie graph,bar graph,line graph,写图表作文时要注意两点:,第一,在描述时,不要“面面俱到”,但要“类类俱到”,即不要把每一项的每一个数据都描述一遍,但一定要把每一项都提到。对于数据的描述,要特别注意选择那些变化最大,最典型,最能说明问题的数据,要在这些数据上做文章。,第二,论点要简单明确,要说明一个问题,而不是几个,而且必须是你所选择的数据所表现出来的问题。因此,写前必须明确下列问题:,
2、Example 1:Changes in Peoples Diet,1986,1987,1988,1989,1990,Grain,51%,49%,46%,43%,35%,Milk,10%,11%,11%,12%,15%,Meat,19%,20%,22%,23%,23%,Fruit and vegetable,20%,20%,21%,22%,27%,Total,100%,100%,100%,100%,100%,图表分析,这张表总体反映了1986年至1990年五年中人们饮食结构方面的变化情况。,1.粮食消费量在逐渐下降,五年间减少了四个百分点;,2.牛奶和肉食的消费量在逐渐增加;,3.水果蔬菜的消
3、费量呈下降趋势。,反映总趋势:人们的饮食结构正在以粮食为主向肉奶蛋高能量的方向转化。,1.五年中经济收入的增长使生活水平提高,人们能够消费得起价格较高的肉奶食品;,2.生活水平的提高使人们已不再满足于吃饱肚子,而开始注重有益健康的科学饮食。,结论:,以上分析表明,人们饮食结构将会朝着更科学,更合理,更营养的趋势发展。,原因分析,Sample,(简述图表信息),As can be seen from the,table,(中心)great changes have been taking place in peoples diet over the period from 1986 to 199
4、0.The consumption of grain has,decreased by 4%,while,the consumption of high quality food,such as milk and meat,has,increased steadily.,(原因分析),There are chiefly two reasons,I,think,for the changes.,In the old days,people could not often afford meat and milk whose price was only within reach of well-
5、to-do families.,But now,with the improvement of living standard,most people have enough money to buy them.,And,people,of today,also pay more attention to nutrition.They want to eat not only more but also better.They are seeking the most reasonable diet structure which will do good to their health.,(
6、结论),In short,with the improvement of peoples living standard,changes in their diet will be more obvious and great.,Mode of traveling,1990,2003,By air,8%,25%,By train,58%,35%,By car,10%,32%,By bike,24%,8%,Total,100%,100%,Example 2:,Changes in the Way of Travel,Outline,Changes in the Way of Travel,下图所
7、示为某城市,1990,年至,2003,年间人们旅行乘车方式的变化,,,请描述其变化,简述你从中得出的结论,Template,The chart describes,(点题),.(概括描述),.,As is shown in the chart,(具体描述某方面),.,What do these changes show?(得出结论).,Sample,The table shows the changes in the way people travel.During the years between 1990 and 2003,the number of people traveling b
8、y train,by air and by private car has changed a great deal.,Sample,As can be seen from the table,there are two remarkable tendencies:one is the rate of traveling,by air,and the other is that by private,cars,.The former rose from 8%in 1990 to 25%in 2003,while the latter from 10%to 32%,both increasing
9、 more than 3 times.The table also shows that the number of people traveling by,train,decreased by 23%though it is still their first choice.,Sample,I think two things caused the changes.First,people are better off.They can afford to travel by air or in their own cars.Second,traveling by train is stil
10、l favored by the majority,since it is cheaper.So,we may predict that as peoples living standard is improving,trains,cars and planes will be three main forms of transportation for long-distance travel.,Useful Expressions,increase,decrease,(1),(2),(3),(4),rise,dramatically,increase,steadily,drop,sharp
11、ly,fall,gradually,Useful Expressions,increase,decrease,increase,rise,jump,dramatically,rapidly,significantly,suddenly,sharply,slightly,gradually,steadily,decrease,decline,drop,fall,Useful Expressions,S,+,V,+,Obj.,double,treble,(1)This country,has doubled her annual output,of steel during the post-wa
12、r years.,(2)The enemys force,trebles ours,.,是过去的,2,倍,增加了,1,倍,是过去的,3,倍,增加了,2,倍,Useful Expressions,S,+,V,+,times+,(1)The gross value of industrial output last year was estimated to,be 2.5 times that of,2000.,(工业总产值),(2)By that time they,will produce three times as much,grain as,they did in 2001.,(3)Th
13、e foreign trade turnover,increased 3.5 times,compared with 2002.,(对外贸易总额),that of,as,+,adj.(sth.),+,as,Useful Expressions,S,+,be,+,times,/%+,S+V+(by)+%,The agricultural output for 2006 is estimated to,be 51%up on,1996.,The grain output,was two times over,that of 1993.,In 1980 crude oil production,rose(by)150 per cent,compared with 1975.,up on,Over,比较级,+,than,增加了多少倍/百分之几,
- 温馨提示:
1: 本站所有资源如无特殊说明,都需要本地电脑安装OFFICE2007和PDF阅读器。图纸软件为CAD,CAXA,PROE,UG,SolidWorks等.压缩文件请下载最新的WinRAR软件解压。
2: 本站的文档不包含任何第三方提供的附件图纸等,如果需要附件,请联系上传者。文件的所有权益归上传用户所有。
3.本站RAR压缩包中若带图纸,网页内容里面会有图纸预览,若没有图纸预览就没有图纸。
4. 未经权益所有人同意不得将文件中的内容挪作商业或盈利用途。
5. 装配图网仅提供信息存储空间,仅对用户上传内容的表现方式做保护处理,对用户上传分享的文档内容本身不做任何修改或编辑,并不能对任何下载内容负责。
6. 下载文件中如有侵权或不适当内容,请与我们联系,我们立即纠正。
7. 本站不保证下载资源的准确性、安全性和完整性, 同时也不承担用户因使用这些下载资源对自己和他人造成任何形式的伤害或损失。
