 图表作文写作技巧

《图表作文写作技巧》由会员分享,可在线阅读,更多相关《图表作文写作技巧(4页珍藏版)》请在装配图网上搜索。
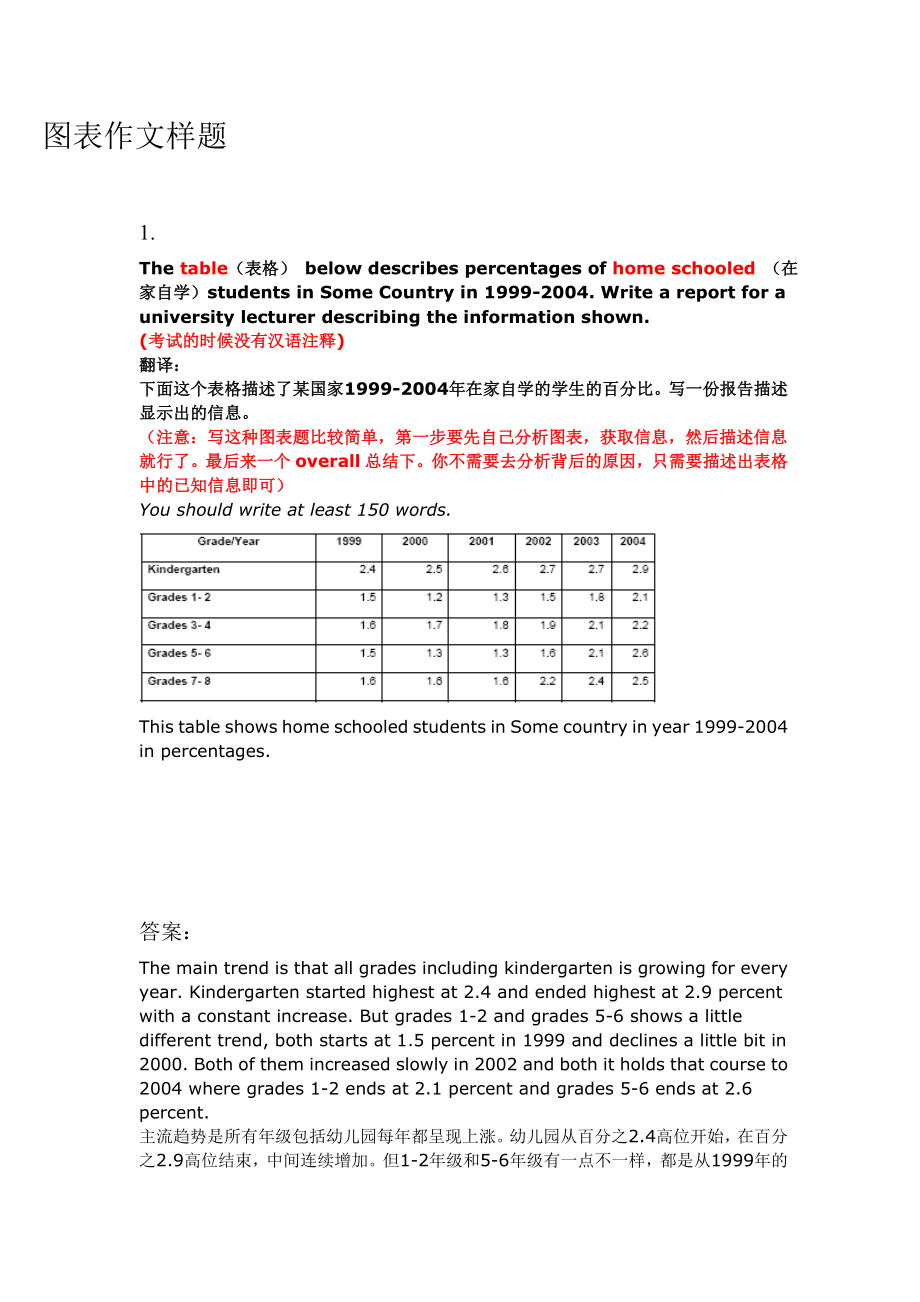
1、图表作文样题1.The table(表格) below describes percentages of home schooled (在家自学)students in Some Country in 1999-2004. Write a report for a university lecturer describing the information shown.(考试的时候没有汉语注释)翻译:下面这个表格描述了某国家1999-2004年在家自学的学生的百分比。写一份报告描述显示出的信息。(注意:写这种图表题比较简单,第一步要先自己分析图表,获取信息,然后描述信息就行了。最后来一个ove
2、rall总结下。你不需要去分析背后的原因,只需要描述出表格中的已知信息即可) You should write at least 150 words.This table shows home schooled students in Some country in year 1999-2004 in percentages. 答案:The main trend is that all grades including kindergarten is growing for every year. Kindergarten started highest at 2.4 and ended hi
3、ghest at 2.9 percent with a constant increase. But grades 1-2 and grades 5-6 shows a little different trend, both starts at 1.5 percent in 1999 and declines a little bit in 2000. Both of them increased slowly in 2002 and both it holds that course to 2004 where grades 1-2 ends at 2.1 percent and grad
4、es 5-6 ends at 2.6 percent.主流趋势是所有年级包括幼儿园每年都呈现上涨。幼儿园从百分之2.4高位开始,在百分之2.9高位结束,中间连续增加。但1-2年级和5-6年级有一点不一样,都是从1999年的百分之1.5开始,然后2000年有一点下降。并且两者在2002年有缓慢增加,直到2004年,1-2年级结束在百分之2.1, 5-6年级结束在百分之2.6.(第一段开始先写一个普遍情况,即都是增加的。然后找到1-2和5-6年级有点奇怪之处,加以分析,一定要列出具体数据。由于没有分析到3-4年级和7-8年级,所以下段一定要分析。)Grades 3-4 has a slow but
5、 steady growth through all six years. It starts at 1.6 percent in 1999 and increases 0.1 every year except in 2003 when it peaks up 0.2 percent. Grades 7-8 starts at 1.6 percent and stays there for three years until it rapidly rises up to 2.2 and peaks at 2.5 in 2004.3-4年级在6年之中一直呈现缓慢但稳步增长。它在1999年的百分
6、之1.6开始,然后每年增加百分之0.1,除了2003年上涨0.2个百分点。7-8年级在1.6个百分点开始,并保持了三年同样的数据,直到其快速上涨到2.2个百分点,然后2004年达到2.5百分点。(第二段,分别描述3-4年级和7-8年级情况。)Overall, all grades including kindergarten has had a rise at roughly minimum 1 percent and more in 6 years.总结,所有的年级包括幼儿园在这6年中都大概上涨了至少1个或更多百分点。(总结很重要,对应的是第一段第一句话,我们发现所有数据都是上涨了.)2.
7、The graph below gives information on wages(工资) of Some country over a ten-year period. Write a report for a university tutor describing the information shown.下列这个图表显示某国10年期间工资信息。写一个报告,描述显示的信息。You should write at least 150 words.The line graph( 线形图) describes the growth of wages in Some country from
8、year 1993 to year 2003. 从图表中我们可以看到几个信息,一个是这个图是在描述工资增长率(growth rate in wages), 纵列一个是工资增长比率(percent growth in wage),横列是年。可以知道,从1993年的2个点,涨到1994年的4个点,然后下降95年中间,又开始回升,这次回升很快,花4年时间直冲到99年的6个百分点。这是个顶峰,从此一蹶不振,降到2002年的1个点,然后又有小幅回升。答案:自己分析The growth started at two percent in 1993, but it didnt stay there very
9、 long before it rapidly doubled in 1994. Then, the percentages declines to three percent in 1995, stayed steady for year, before starting to rise slowly and ending up just under four percent in 1997. 1998 was the best year where the wages peaked at six percent.However, after 1998 the wages declined
10、nearly every year. Only a year after, the percentage dropped to well under three percent, stayed there on roughly three percent till 2000. In 2002 the wages reached the lowest point of just one percent growth. Luckily the growth rose in 2003 at just under two percent.Overall, the growth rate in wage
11、s in Some country has shown striking changes through the ten years.3.The graph below shows annual water usage (in millions of cubic meters) by industries in Some country. Write a report for a university tutor describing the information shown.You should write at least 150 words.The paragraph describe
12、s the water usage for every year in Some country in millions of cubic meters.The water usage are shown in two trends, ground water and public supply. Fuel and textiles are the ones that uses the least water, 10 of public supply and 70 and 80 of ground water. Machinery are just the opposite of these
13、two and has 10 of ground water and 100 of public supply.Food/drinks, metal, paper and chemicals are all over 100 of ground water where chemicals peaks at dramatically 430. The highest number of water usage of public supplies also belongs to chemicals (240). Next on the list is food/drinks with 190,
14、the others are under 100.Overall, the chemical industry uses a lot more water then the rest of the industries in terms of both ground water and public supplies, and in general most industries use ground water by far more than public supplies.分析完三个图标,我们应该已经明白了图标题的写作方式,只要把其中关键的词汇如start, end,decline, grow等关键转折词汇灵活运用就可以了。分析图表的时候要学会找到相同的和不同的地方,以及总体的趋势。
- 温馨提示:
1: 本站所有资源如无特殊说明,都需要本地电脑安装OFFICE2007和PDF阅读器。图纸软件为CAD,CAXA,PROE,UG,SolidWorks等.压缩文件请下载最新的WinRAR软件解压。
2: 本站的文档不包含任何第三方提供的附件图纸等,如果需要附件,请联系上传者。文件的所有权益归上传用户所有。
3.本站RAR压缩包中若带图纸,网页内容里面会有图纸预览,若没有图纸预览就没有图纸。
4. 未经权益所有人同意不得将文件中的内容挪作商业或盈利用途。
5. 装配图网仅提供信息存储空间,仅对用户上传内容的表现方式做保护处理,对用户上传分享的文档内容本身不做任何修改或编辑,并不能对任何下载内容负责。
6. 下载文件中如有侵权或不适当内容,请与我们联系,我们立即纠正。
7. 本站不保证下载资源的准确性、安全性和完整性, 同时也不承担用户因使用这些下载资源对自己和他人造成任何形式的伤害或损失。
