 2023年雅思小作文笔记

《2023年雅思小作文笔记》由会员分享,可在线阅读,更多相关《2023年雅思小作文笔记(13页珍藏版)》请在装配图网上搜索。
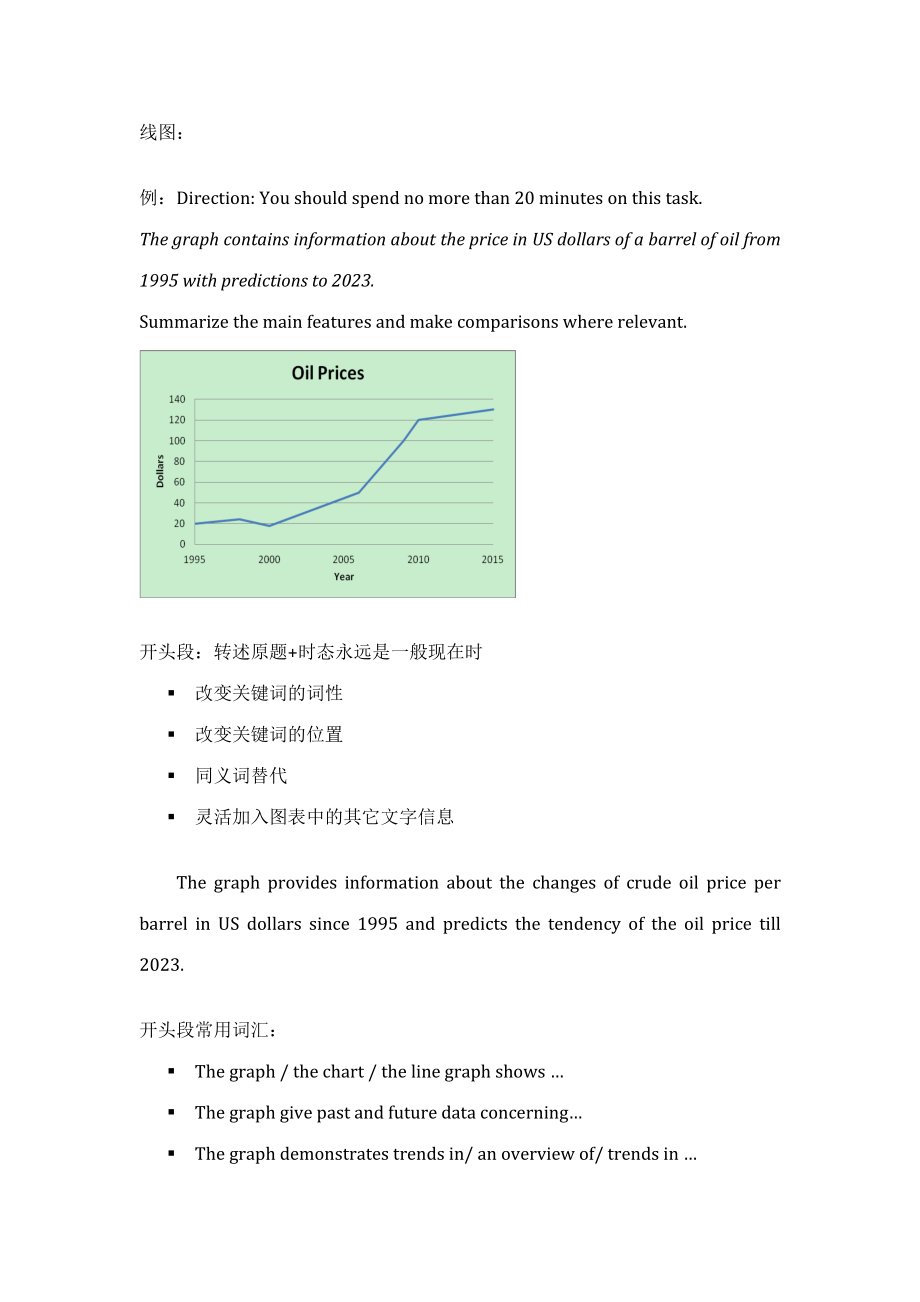
1、线图:例:Direction: You should spend no more than 20 minutes on this task.The graph contains information about the price in US dollars of a barrel of oil from 1995 with predictions to 2023.Summarize the main features and make comparisons where relevant. 开头段:转述原题+时态永远是一般现在时 改变关键词的词性 改变关键词的位置 同义词替代 灵活加入图表
2、中的其它文字信息 The graph provides information about the changes of crude oil price per barrel in US dollars since 1995 and predicts the tendency of the oil price till 2023.开头段常用词汇: The graph / the chart / the line graph shows The graph give past and future data concerning The graph demonstrates trends in/
3、 an overview of/ trends in Shows: indicates/ unfolds/ displays/ reveals/ reflects/ relates/ illustrates/ demonstrates/ describes/ depicts/ portray/ outlines/ provide an overview of例:The graphs below show the enrolments of overseas students and local students in Britains universities.The graphs provi
4、de information about the proportions of overseas students and local students enrolled in Britains Universities from 1989 to 1999. 主体部分1+X句:第一句总结总体趋势,之后分步描述(起点,极值,终点)。总体趋势:Overall, oil prices increased by nearly four hundred percent from 1995 to 2023, with the most dramatic increase in the three year
5、s from 2023 to 2023 and this rise is predicted to continue into the future. 分步描述(起点+极值+终点): Prices started at twenty US dollars a barrel during 1995, and then rose slightly to approximately twenty-four dollars in 1998. The cost of a barrel then dropped for two years, to the lowest point of about eig
6、hteen dollars during 2023. After that, there was a steady price rise, reaching about fifty dollars a barrel in 2023. This was followed by a dramatic climb to one hundred dollars in 2023, and after that, the data continue to rise but slightly, finally reaching the highest point of 130 by 2023. 主体段常用词
7、汇:第1句话 a) The overall trend/ general trend indicate that b) There is an overall + 某种趋势的名词第2句话之前To be more exact = more exactlyTo be more precise= more preciselyTo be more specific = more specifically上升动词:rise to/ increase to/ go up to/ climb to 名词:a rise in/ an increase in/ a growth in/ an upward tr
8、end in/ a boom in急剧上升:jump/ surge/ shoot up/ soar下降动词:fall to/ decrease to/ dip to/ drop to / go down to/ slumped to名词:a fall in/ a decline in/ a decrease in/ a slump in/ a reduction in急剧下降:plummet / plunge速度快Sharp/ dramatic/ drastic/ rapid/ steep缓慢Gradual/ steady/ gentle/ slow波动Fluctuate around/ a
9、fluctuation in稳定在Level off at/ level out at/ stabilize at/ remain constant/ remain steady at最高点Peak at/ reach the highest point of最低点Reach the bottom of/ the lowest point of / bottom out at达成Reach/ arrive at/ amount to/ hit/ stand at/ register占多少Account for / represent/ constitute/ make up/ occupy预测
10、It is suggested/ predicted/ expected/ projected大约Approximately/ roughly/ just over/ under/ around分别Respectively/ separately关于 as for/ in terms of/ concerning/ regarding 常用时间过渡词 Then/ from this time onwards / from then onAfter / before ( prior to)其他关联词while/ whereasHowever/ by contrast/ conversely/ o
11、n the contrarySimilarly/ likewise重要句型(1)There be句型There is an increase in the number of There are increasingly more (2)纵坐标作主语 The number (percentage) of went up / down(3)横坐标作主语(一般是时间)表达经历: see/ witness/ experience结尾段: paraphrase趋势句,总结最有特性的点. In summary, it is predicted that oil prices tends to incre
12、ase. Besides, the price in 2023 is projected to be more than six times that in 1995.例:The information in the graph below contains information about the cost of a house in Britain over 40 years, with projections into the future. The line graph presents us the UK house prices changes in pounds sterlin
13、g of 45 years from 1970 to 2023. In general, the UK house prices has kept rising since 1970 and will continue to rise in the coming five years. At the first five years between 1970 and 1975, the house price in UK remains constant at 100 thousand and in the following decade, rose only slightly to 120
14、 by 1985. Then there is a gentle decrease to around 115 in 1990. The number began to climb again since 1990, but still steadily. However, since 2023, the number jumped to a peak of 190 by 2023 and then began to decline.In conclusion, the UK house prices are supposed to decline in the five coming yea
15、rs but above 180 thousand pounds sterling. 高分语言示范:Number of full-time teachers of regular schools (in millions) in China (1960-1990)1. There be + 定语从句which(There was a rise from , which was followed by an increase/ decrease / which led to/ which preceded.) According to the figure, there was a sharp
16、decrease in the number of teachers from five million in 1960 to three million in 1962, which was followed by a rapid increase over the next two years.2. Before + V-ing From 1960 to 1962, the number of full-time teachers went down from 5 million to the bottom of 3 million before rising to 5 million i
17、n the following two years. 3. 并列结构and + until 定语从句whenThe number dropped again from almost six million in 1964 to five million in 1966 and then went up gradually until 1976 when there was a leveling-off at eight million for the next ten years.4. 定语从句which + 非谓语动词V-ing From that time onwards, there w
18、as a slow decrease to 5 million in 1966, which was followed by a rapid increase of 3 million, leveling off/ out at 8 million in 1976 and remaining constant at that level in the next 10 years.5. 年代作主语 + 非谓语动词V-ing 1986 to 1990 witnessed a rising number of teachers, peaking at / reaching the highest p
19、oint of 10 in 1990.6. 同位语From 1986 to 1990, the figure/ data climbed steadily to 10, the peak of all time. 双线图和多线图:分开描述,最后比较。例1:The graph below shows radio and television audiences throughout the day in 1992.Percentage of UK population over 4 years old Time of day and nightThe graph shows the percen
20、tage of radio and television audiences over 4 years old in the UK throughout one day of 1992. Generally/ on the whole,both graphs increased before a decrease afterwards both line graphs fluctuated during a day. (中间段:整体趋势) The data indicates that radio listeners increased (grow, go up) substantially
21、(dramatically, sharply) from 10 percent in 6 am to 25% in 8 am, a peak of all time. The percentage then declined (decrease, drop) steadily to 11% at 4 pm and 2% until 4 am, a bottom of all time. The hour from 4 am to 6 am experienced a gentle rise. (Radio) As for/ concerning TV viewers/ the graph of
22、 Television viewers, from 6 am to 8:30 am the percentage went up from no more than 2% to 8%, leveling off at that line in the following two hours, which was followed by a slight decrease until 12 am. From then on, the figure went up gradually to 15%. Despite a little drop afterwards, the percentage
23、of TV viewers went on an upward trend from 2 pm to the peak of no less than 45% at 8 pm. After that, the line graph dropped rapidly, reaching a bottom of 2% at 4 pm and experienced little change in the next two hours. (TV) From the chart, it is found that before 2 pm, the number of radio viewers out
24、performed / outweighed / prevailed over that of TV viewers while the opposite was true after 2 pm. Besides/ in addition, the prime time for radio and television was 8 am and 8 pm respectively. (结尾段)例2:The graph below compares changes in the birth rates of China and the USA between 1920 and 2023.Birt
25、h rate (%) Year A glance at the graph provided reveals some striking similarities between the Chinese and US birth rates during the period from 1920 to 2023. It is evident that both nations saw considerable fluctuations in fertility, with lows during the 1940s and highs during the 1950s. Increasing
26、from approximately 10 percent in 1920 to 15 percent in 1935, Chinas birth rate then plunged to a low of just 5 percent in the 1940s. This was followed by a period of exponential growth, with fertility in the country reaching a peak of 20 percent in 1950. The latter half of the century, however, brou
27、ght a sustained decline in this figure.The US birth rate, meanwhile, fluctuated at somewhere between 11 and 13 percent prior to 1940, before dropping sharply to less than 5 percent in 1945. The following 5 years saw a rapid climb in this rate, to somewhere in the vicinity of 14 percent in 1950, foll
28、owed by a steady fall. It is interesting to note that while the birth rates of both countries were comparable until 1950, the gap between the two widened after this time as fertility in China slide away.例3:The graph below shows the consumption of fish and some different kinds of meat on a European c
29、ountry between 1979 and 2023. The graph illustrates changes in the amount of beef, lamp, chicken and fish consumed in a particular European country between 1979 and 2023. In 1979, beef was by far the most popular of these food, with about 225 grams consumed per person per week. Lamb and chicken were
30、 eaten in similar quantities (around 150 grams), while much less fish was consumed (just over 50 grams). However, during this 25-year period the consumption of beer and lamb fell dramatically to approximately 100 grams and 55 grams respectively. The consumption of fish also declined, but much less s
31、ignificantly to just below 50 grams, so although it remained the least popular food, consumption levels were the most stable. The consumption of chicken, on the other hand, showed an upward trend, overtaking that of lamb in 1980 and that of beef in 1989. By 2023, it had soared to almost 250 grams pe
32、r person per week. Overall, the graph shows how the consumption of chicken increased dramatically while the opportunity of these other foods decreased over the period.例4:The graph below shows peoples life expectancy in five different countries from 1970 to 2023. Summarise the information by reportin
33、g and selecting the main features, and make comparisons where relevant. A glance at the multiple-line graph provided reveals the average life span in five countries over a period of forty years, from 1970 to 2023. Generally speaking, Panac and Sejen saw an increase in life expectancy, but Rothan, So
34、uth Nagin and Zaceb experienced a decrease. (总体趋势) In 1970, Panac and Sejen had the highest average life expectancy, at 71 and 74 years old respectively. This figure steadily increased throughout the years, reaching 80 or just above by 2023.Rothan citizens could expect to live up to 68 years old on
35、average in 1970. There was a slight drop to 65 in 2023 and this remained steady until 2023. In contrast, South Nagin and Zaceb had a shorter average life expectancy than the other three countries at 52 years old in 1970, rising to just under 60 in 1980 and staying fairly constant for a decade or more. Then both countries life spans fell quite dramatically to 45 and 38 years old respectively in 2023. In summary, the public in Panac and Sejen enjoyed longer life expectancy compared with people in other three countries.
- 温馨提示:
1: 本站所有资源如无特殊说明,都需要本地电脑安装OFFICE2007和PDF阅读器。图纸软件为CAD,CAXA,PROE,UG,SolidWorks等.压缩文件请下载最新的WinRAR软件解压。
2: 本站的文档不包含任何第三方提供的附件图纸等,如果需要附件,请联系上传者。文件的所有权益归上传用户所有。
3.本站RAR压缩包中若带图纸,网页内容里面会有图纸预览,若没有图纸预览就没有图纸。
4. 未经权益所有人同意不得将文件中的内容挪作商业或盈利用途。
5. 装配图网仅提供信息存储空间,仅对用户上传内容的表现方式做保护处理,对用户上传分享的文档内容本身不做任何修改或编辑,并不能对任何下载内容负责。
6. 下载文件中如有侵权或不适当内容,请与我们联系,我们立即纠正。
7. 本站不保证下载资源的准确性、安全性和完整性, 同时也不承担用户因使用这些下载资源对自己和他人造成任何形式的伤害或损失。
