 六西格玛绿带培训

《六西格玛绿带培训》由会员分享,可在线阅读,更多相关《六西格玛绿带培训(278页珍藏版)》请在装配图网上搜索。
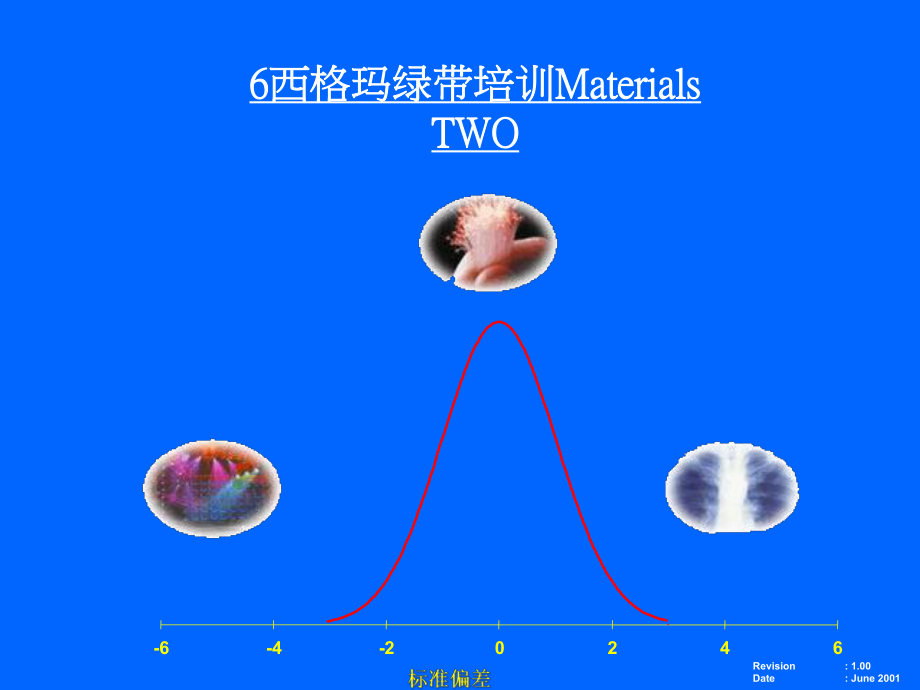
1、Revision:1.00Date:June 20016 6西格玛绿带培训西格玛绿带培训MaterialsMaterialsTWOTWO-6-4-20246第二天:Tests of Hypotheses-Week 1 recap of Statistics Terminology-Introduction to Student T distribution-Example in using Student T distribution-Summary of formula for Confidence Limits-Introduction to Hypothesis Testing-The
2、elements of Hypothesis Testing-Break-Large sample Test of Hypothesis about a population mean-p-Values,the observed significance levels-Small sample Test of Hypothesis about a population mean-Measuring the power of hypothesis testing-Calculating Type II Error probabilities-Hypothesis Exercise I-Lunch
3、-Hypothesis Exercise I Presentation-Comparing 2 population Means:Independent Sampling-Comparing 2 population Means:Paired Difference Experiments-Comparing 2 population Proportions:F-Test-Break-Hypothesis Testing Exercise II(paper clip)-Hypothesis Testing Presentation-第一天wrap up第二天:Analysis of varian
4、ce 和simple linear regression-Chi-square:A test of independence-Chi-square:Inferences about a population variance-Chi-square exercise-ANOVA-Analysis of variance-ANOVA Analysis of variance case study-Break-Testing the fittness of a probability distribution-Chi-square:a goodness of fit test-The Kolmogo
5、rov-Smirnov Test-Goodness of fit exercise using dice-Result 和discussion on exercise-Lunch-Probabilistic 关系hip of a regression model-Fitting model with least square approach-Assumptions 和variance estimator-Making inference about the slope-Coefficient of Correlation 和Determination-Example of simple li
6、near regression-Simple linear regression exercise(using statapult)-Break-Simple linear regression exercise(cont)-Presentation of results-第二天wrap upDay 3:Multiple regression 和model building-Introduction to multiple regression model-Building a model-Fitting the model with least squares approach-Assump
7、tions for model-Usefulness of a model-Analysis of variance-Using the model for estimation 和prediction-Pitfalls in prediction model-Break-Multiple regression exercise(statapult)-Presentation for multiple regression exercise-Lunch-Qualitative data 和dummy variables-Models with 2 or more quantitative in
8、dependent variables-Testing the model-Models with one qualitative independent variable-Comparing slopes 和response curve-Break-Model building example-Stepwise regression an approach to screen out factors-Day 3 wrap upDay 4:设计of Experiment-Overview of Experimental Design-What is a designed experiment-
9、Objective of experimental 设计和its capability in identifying the effect of factors-One factor at a time(OFAT)versus 设计of experiment(DOE)for modelling-Orthogonality 和its importance to DOE-H和calculation for building simple linear model-Type 和uses of DOE,(i.e.linear screening,linear modelling,和non-linear
10、 modelling)-OFAT versus DOE 和its impact in a screening experiment-Types of screening DOEs-Break-Points to note when conducting DOE-Screening DOE exercise using statapult-Interpretating the screening DOEs result-Lunch-Modelling DOE(Full factoria with interactions)-Interpreting interaction of factors-
11、Pareto of factors significance-Graphical interpretation of DOE results-某些rules of thumb in DOE-实例of Modelling DOE 和its analysis-Break-Modelling DOE exercise with statapult-Target practice 和confirmation run-Day 4 wrap upDay 5:Statistical 流程Control-What is Statistical 流程Control-Control chart the voice
12、 of the 流程-流程control versus 流程capability-Types of control chart available 和its application-Observing trends for control chart-Out of Control reaction-Introduction to Xbar R Chart-Xbar R Chart example-Assignable 和Chance causes in SPC-Rule of thumb for SPC run test-Break-Xbar R Chart exercise(using Di
13、ce)-Introduction to Xbar S Chart-Implementing Xbar S Chart-为什么Xbar S Chart?-Introduction to Individual Moving Range Chart-Implementing Individual Moving Range Chart-为什么Xbar S Chart?-Lunch-Choosing the sub-group-Choosing the correct sample size-Sampling frequency-Introduction to control charts for at
14、tribute data-np Charts,p Charts,c Charts,u Charts-Break-Attribute control chart exercise(paper clip)-Out of control not necessarily is bad-Day 5 wrap upRecap of Statistical TerminologyDistributions differs in locationDistributions differs in spreadDistributions differs in shapeNormal Distribution-6-
15、5-4-3-2-1 01 2 3 4 5 6 -99.9999998%-99.73%-95.45%-68.27%-3 variation is called natural tolerance Area under a Normal Distribution流程流程capability potential,CpBased on the assumptions that:1.流程is normalNormal Distribution-6 -5 -4 -3 -2 -1 01 2 3 4 5 6 Lower Spec LimitLSLUpper Spec LimitUSLSpecification
16、 Center2.It is a 2-sided specification3.流程mean is centered to the device specificationSpread in specificationNatural toleranceCP=USL-LSL6 8 6=1.33流程流程Capability Index,Cpk1.Based on the assumption that the 流程is normal 和in control2.An index that compare the 流程center with specification centerNormal Dis
17、tribution-6 -5 -4 -3 -2 -1 01 2 3 4 5 6 Lower Spec LimitLSLUpper Spec LimitUSLSpecification CenterTherefore when,Cpk 20)Estimated 标准偏差标准偏差,R/d2 Population 标准偏差标准偏差,(when sample size,n 20)Probability TheoryProbability is the chance for an event to occur.Statistical dependence/independence Posterior p
18、robability Relative frequency Make decision through probability distributions(i.e.Binomial,Poisson,Normal)Central Limit TheoremRegardless the actual distribution of the population,the distribution of the mean for sub-groups of sample from that distribution,will be normally distributed with sample me
19、an approximately equal to the population mean.Set confidence interval for sample based on normal distribution.A basis to compare samples using normal distribution,hence making statistical comparison of the actual populations.It does not implies that the population is always normally distributed.(Cp,
20、Cpk must always based on the assumption that 流程流程is normal)Inferential StatisticsThe 流程流程of interpreting the sample data to draw conclusions about the population from which the sample was taken.Confidence Interval(Determine confidence level for a sampling mean to fluctuate)T-Test 和和F-Test(Determine
21、if the underlying populations is significantly different in terms of the means 和和variations)Chi-Square Test of Independence(Test if the sample proportions are significantly different)Correlation 和和Regression(Determine if 关系关系hip between variables exists,和和generate model equation to predict the outco
22、me of a single output variable)Central Limit Theorem1.The mean x of the sampling distribution will approximately equal to the population mean regardless of the sample size.The larger the sample size,the closer the sample mean is towards the population mean.2.The sampling distribution of the mean wil
23、l approach normality regardless of the actual population distribution.3.It assures us that the sampling distribution of the mean approaches normal as the sample size increases.m=150Population distributionx =150Sampling distribution(n=5)x =150Sampling distribution(n=20)x =150Sampling distribution(n=3
24、0)m=150Population distributionx =150Sampling distribution(n=5)某些某些take aways for sample size 和和sampling distribution For large sample size(i.e.n 30),the sampling distribution of x will approach normality regardless the actual distribution of the sampled population.For small sample size(i.e.n 30),the
25、 sampling distribution of x is exactly normal if the sampled population is normal,和will be approximately normal if the sampled population is also approximately normally distributed.The point estimate of population 标准偏差 using S equation may 提供a poor estimation if the sample size is small.Introduction
26、 to Student t Distrbution Discovered in 1908 by W.S.Gosset from Guinness Brewery in Ireland.To compensate for 标准偏差 dependence on small sample size.Contain two random quantities(x 和S),whereas normal distribution contains only one random quantity(x only)As sample size increases,the t distribution will
27、 become closer to that of standard normal distribution(or z distribution).Percentiles of the t DistributionWhereby,df =Degree of freedom =n(sample size)1Shaded area =one-tailed probability of occurencea =1 Shaded areaApplicable when:Sample size 30 标准偏差 is unknown Population distribution is at least
28、approximately normally distributed0.750.900.950.9750.990.9950.999511.00003.07776.313712.706231.821063.6559636.577620.81651.88562.92004.30276.96459.925031.599830.76491.63772.35343.18244.54075.840812.924440.74071.53322.13182.77653.74694.60418.610150.72671.47592.01502.57063.36494.03216.868560.71761.439
29、81.94322.44693.14273.70745.958770.71111.41491.89462.36462.99793.49955.408180.70641.39681.85952.30602.89653.35545.041490.70271.38301.83312.26222.82143.24984.7809100.69981.37221.81252.22812.76383.16934.5868110.69741.36341.79592.20102.71813.10584.4369120.69551.35621.78232.17882.68103.05454.3178130.6938
30、1.35021.77092.16042.65033.01234.2209140.69241.34501.76132.14482.62452.97684.1403150.69121.34061.75312.13152.60252.94674.0728160.69011.33681.74592.11992.58352.92084.0149170.68921.33341.73962.10982.56692.89823.9651180.68841.33041.73412.10092.55242.87843.9217190.68761.32771.72912.09302.53952.86093.8833
31、200.68701.32531.72472.08602.52802.84533.8496210.68641.32321.72072.07962.51762.83143.8193220.68581.32121.71712.07392.50832.81883.7922230.68531.31951.71392.06872.49992.80733.7676240.68481.31781.71092.06392.49222.79703.7454250.68441.31631.70812.05952.48512.78743.7251260.68401.31501.70562.05552.47862.77
32、873.7067270.68371.31371.70332.05182.47272.77073.6895280.68341.31251.70112.04842.46712.76333.6739290.68301.31141.69912.04522.46202.75643.6595300.68281.31041.69732.04232.45732.75003.6460 0.6741.2821.6451.962.3262.5763.291Area under the curvedf,u ut(a a,u u)a aArea under the curvePercentiles of the Nor
33、mal Distribution/Z Distribution00.010.020.030.040.050.060.070.080.0900.50000.50400.50800.51200.51600.51990.52390.52790.53190.53590.10.53980.54380.54780.55170.55570.55960.56360.56750.57140.57530.20.57930.58320.58710.59100.59480.59870.60260.60640.61030.61410.30.61790.62170.62550.62930.63310.63680.6406
34、0.64430.64800.65170.40.65540.65910.66280.66640.67000.67360.67720.68080.68440.68790.50.69150.69500.69850.70190.70540.70880.71230.71570.71900.72240.60.72570.72910.73240.73570.73890.74220.74540.74860.75170.75490.70.75800.76110.76420.76730.77040.77340.77640.77940.78230.78520.80.78810.79100.79390.79670.7
35、9950.80230.80510.80780.81060.81330.90.81590.81860.82120.82380.82640.82890.83150.83400.83650.838910.84130.84380.84610.84850.85080.85310.85540.85770.85990.86211.10.86430.86650.86860.87080.87290.87490.87700.87900.88100.88301.20.88490.88690.88880.89070.89250.89440.89620.89800.89970.90151.30.90320.90490.
36、90660.90820.90990.91150.91310.91470.91620.91771.40.91920.92070.92220.92360.92510.92650.92790.92920.93060.93191.50.93320.93450.93570.93700.93820.93940.94060.94180.94290.94411.60.94520.94630.94740.94840.94950.95050.95150.95250.95350.95451.70.95540.95640.95730.95820.95910.95990.96080.96160.96250.96331.
37、80.96410.96490.96560.96640.96710.96780.96860.96930.96990.97061.90.97130.97190.97260.97320.97380.97440.97500.97560.97610.976720.97720.97780.97830.97880.97930.97980.98030.98080.98120.98172.10.98210.98260.98300.98340.98380.98420.98460.98500.98540.98572.20.98610.98640.98680.98710.98750.98780.98810.98840
38、.98870.98902.30.98930.98960.98980.99010.99040.99060.99090.99110.99130.99162.40.99180.99200.99220.99250.99270.99290.99310.99320.99340.99362.50.99380.99400.99410.99430.99450.99460.99480.99490.99510.99522.60.99530.99550.99560.99570.99590.99600.99610.99620.99630.99642.70.99650.99660.99670.99680.99690.99
39、700.99710.99720.99730.99742.80.99740.99750.99760.99770.99770.99780.99790.99790.99800.99812.90.99810.99820.99820.99830.99840.99840.99850.99850.99860.998630.99870.99870.99870.99880.99880.99890.99890.99890.99900.9990Area under the curveZZa aArea under the curveWhereby,Shaded area =one-tailed probabilit
40、y of occurencea =1 Shaded areaStudent t Distrbution exampleFDA requires pharmaceutical companies to perform extensive tests on all new drugs before they can be marketed to the public.The first phase of testing will be on animals,while the second phase will be on human on a limited basis.PWD is a pha
41、rmaceutical company currently in the second phase of testing on a new antibiotic project.The chemists are interested to know the effect of the new antibiotic on the human blood pressure,和they are only allowed to test on 6 patients.The result of the increase in blood pressure of the 6 tested patients
42、 are as below:(1.7 ,3.0 ,0.8 ,3.4 ,2.7 ,2.1 )Construct a 95%confidence interval for the average increase in blood pressure for patients taking the new antibiotic,using both normal 和t distributions.Student t Distrbution example(cont)Using normal or z distribution0.76 2.283 (0.388)1.96 2.283 nS Z X in
43、terval confidence 95%S Deviation,Std 2.283 613.7 2.1)2.7 3.4 0.8 3 (1.7 X Mean,0.05 level,Confidence6 n size,Sample2)/(aa95.0 6Using student t distribution0.997 2.283 (0.388)2.571 2.283 nS t X interval confidence 95%S Deviation,Std 2.283 613.7 2.1)2.7 3.4 0.8 3 (1.7 X Mean,1)-6(i.e.5 freedom,of Degr
44、ee0.05 level,Confidence6 n size,Sample2)/(aua95.0 6Although the confidence level is the same,using t distribution will result in a larger interval value,because:标准偏差标准偏差,S for small sample size is probably not accurate 标准偏差标准偏差,S for small sample size is probably too optimistic Wider interval is the
45、refore necessary to achieve the required confidence level Summary of formula for confidence limitdata attribute for npq2)/Z(p limit Confidence data continuous for nS2)/Z(X limit Confidenceknown is deviation standard population whenor,30)(n size sample large Foraadata attribute for npq2)/t(p limit Co
46、nfidence data continuous for nS2)/t(X limit Confidencedeviation standard population unknown with30)(n size sample small Foraa6 Sigma 流程和流程和1.5 Sigma Shift in MeanStatistically,a 流程that is 6 Sigma with respect to its specifications is:Normal Distribution-6-5-4-3-2-1 01 2 3 4 5 6 -99.9999999998%-LSLUS
47、LDPM=0.002Cp=2Cpk=2But Motorola defines 6 Sigma with a scenario of 1.5 Sigma shift in meanDPM=3.4Cp=2Cpk=1.51.5 某些某些Explanations on 1.5 Sigma Mean Shift 1.Motorla has conducted a lot of experiments,和found that in long term,the 流程mean will shift within 1.5 sigma if the 流程is under control.2.1.5 sigma
48、mean shift in a 3 Sigma 流程control plan will be translated to approximately 14%of the time a data point will be out of control,和this is deem acceptable in statistical 流程control(SPC)practices.Normal Distribution-3-2-1 01 2 3-99.74%-LCLUCLDistribution with 1.5 Sigma Shift-3-2-1 01 2 3-86.64%-LCLUCLOut
49、of control data pointsOur Explanation Most frequently used sample size for SPC in industry is 3 to 5 units per sampling.Take the middle value of 4 as an average sample size used in the sampling.Assuming the 流程is of 6 sigma capability,is in control,和is normally distributed.Under the confidence interv
50、al for sampling distribution,we expect the average value of the samples to fluctuate within 3 standard errors(i.e.natural tolerance),giving confidence interval of:data continuous for Sigma 1.5 X limit Confidence data continuous for 2Sigma 3 X limit Confidence data continuous for 4Sigma3 X limit Conf
51、idence data continuous for nSigma3 X limit ConfidenceIntroduction to Hypothesis Testing?What is hypothesis testing in statistic?A hypothesis is“a tentative assumption made in order to draw out or test its logical or empirical consequences.”A statistical hypothesis is a statement about the value of o
52、ne of the characteristics for one or more populations.The purpose of the hypothesis is to establish a basis,so that one can gather evidence to either disprove the statement or accept it as true.lExample of statistical hypothesis The average commute time using Highway 92 is shorter than using France
53、Avenue.This 流程流程change will not cause any effect on the downstream 流程流程es.The variation of Vendor Bs parts are 40%wider than those of Vendor A.Elements of Hypothesis TestingPossible outcomes for hypothesis testing on two tested populations:No Significant DifferenceSignificant Difference in Variation
54、Significant Difference in MeanSignificant Difference in both Mean 和和Variationm m1 m m2 1=2m m1 m m2 1 2m m1=m m2 1 2m m1=m m2 1=2为什么为什么Hypothesis Testing?Many problems require a decision to accept or reject a statement about a parameter.That statement is a Hypothesis.It represents the translation of
55、 a practical question into a statistical question.Statistical testing 提供提供s an objective solution,with known risks,to questions which are traditionally answered subjectively.It is a stepping stone to 设计设计of Experiment,DOE.Hypothesis Testing Descriptions Hypothesis Testing answers the practical quest
56、ion:“Is there a real difference between A 和和B?”In hypothesis testing,relatively small samples are used to answer questions about population parameters.There is always a chance that a sample that is not representative of the population being selected 和和results in drawing a wrong conclusion.Elements o
57、f Hypothesis Testing(cont)The Null Hypothesis Statement generally assumed to be true unless sufficient evidence is found to be contrary Often assumed to be the status quo,or the preferred outcome.However,it sometimes represents a state you strongly want to disprove.Designated as H0 In hypothesis tes
58、ting,we always bias toward null hypothesisThe Alternative Hypothesis(or Research Hypothesis)Statement that will be accepted only if data 提供convincing evidence of its truth(i.e.by rejecting the null hypothesis).Instead of comparing two populations,it can also be based on a specific engineering differ
59、ence in a characteristic value that one desires to detect(i.e.instead of asking is m1=m2,we ask is m1 450).Designated as H1Elements of Hypothesis Testing(cont)Example if we want to test whether a population mean is equal to 500,we would translate it to:Null Hypothesis,H0:m mp=500和consider alternate
60、hypothesis as:Alternate Hypothesis,H1:m mp 500;(2 tails test)Remember confidence interval,at 95%confidence level states that:95%of the time the mean value will fluctuate within the confidence interval(limit)5%chance that the mean is natural fluctuation,but we think it is not alpha(a)probability-Conf
61、idence limit-m mH0=5000.025 of area0.025 of area(a a/2)reject area(a a/2)reject area1.96std error1.96std errorType II ErrorAccepting a null hypothesis(H0),when it is false.Probability of this error equals b bType I ErrorRejecting the null hypothesis(H0),when it is true.Probability of this error equa
62、ls a aIf m mp is within confidence limit,accept the null hypothesis H0.If m mp is in reject area,reject the null hypothesis H0.Use the std error observed from the sample to set confidence limit on 500(mH0).The assumption is mH0 has the same variance as mp.Elements of Hypothesis Testing(cont)Other po
63、ssible alternate hypothesis are:1.Alternate Hypothesis,H1:m mp 500;(1 tail test)2.Alternate Hypothesis,H1:m mp 500 For 95%confidence level,a=0.05.Since H1 is one tail test,reject area does not need to be divided by 2.00.010.020.030.040.0510.84130.84380.84610.84850.85080.85311.10.86430.86650.86860.87
64、080.87290.87491.20.88490.88690.88880.89070.89250.89441.30.90320.90490.90660.90820.90990.91151.40.91920.92070.92220.92360.92510.92651.50.93320.93450.93570.93700.93820.93941.60.94520.94630.94740.94840.94950.9505ZArea under the curveFrom standard normal distribution table:Z-value of 1.645 will give 0.9
65、5 area,leaving a to be 0.05.Therefore if mp is more than 500 by 1.645 std error,it will be in the reject area,和we will reject the null hypothesis H0,concluding on alternate hypothesis H1 that mp is 500.某些某些hypothesis testings that are applicable to engineers:The impact on response measurement with n
66、ew 和和old 流程流程parameters.Comparison of a new vendors parts(which are slightly more expensive)to the present vendor,when variation is a major issue.Is the yield on Tester ECTZ21 the same as the yield on Tester ECTZ33?流程流程Situations Comparison of one population from a single 流程流程to a desirable standard Comparison of two populations from two different 流程流程esor Single sided:comparison considers a difference only if it is greater or only if it is less,but not both.Two sided:comparison considers any di
- 温馨提示:
1: 本站所有资源如无特殊说明,都需要本地电脑安装OFFICE2007和PDF阅读器。图纸软件为CAD,CAXA,PROE,UG,SolidWorks等.压缩文件请下载最新的WinRAR软件解压。
2: 本站的文档不包含任何第三方提供的附件图纸等,如果需要附件,请联系上传者。文件的所有权益归上传用户所有。
3.本站RAR压缩包中若带图纸,网页内容里面会有图纸预览,若没有图纸预览就没有图纸。
4. 未经权益所有人同意不得将文件中的内容挪作商业或盈利用途。
5. 装配图网仅提供信息存储空间,仅对用户上传内容的表现方式做保护处理,对用户上传分享的文档内容本身不做任何修改或编辑,并不能对任何下载内容负责。
6. 下载文件中如有侵权或不适当内容,请与我们联系,我们立即纠正。
7. 本站不保证下载资源的准确性、安全性和完整性, 同时也不承担用户因使用这些下载资源对自己和他人造成任何形式的伤害或损失。
