 ASIATECHNOLOGYSEMICONDUCTORSDRAMMOBILECOMPETITIONCONTINUESALBEITSTABILIZINGPCDRAM1128

《ASIATECHNOLOGYSEMICONDUCTORSDRAMMOBILECOMPETITIONCONTINUESALBEITSTABILIZINGPCDRAM1128》由会员分享,可在线阅读,更多相关《ASIATECHNOLOGYSEMICONDUCTORSDRAMMOBILECOMPETITIONCONTINUESALBEITSTABILIZINGPCDRAM1128(13页珍藏版)》请在装配图网上搜索。
1、30%November 28,2012Asia:Technology:SemiconductorsEquity ResearchDRAM:Mobile competition continues albeit stabilizing PC DRAMPC DRAM price stabilizing on supply cutsAfter posting a 14%qoq decline in 3Q12,commodity DRAM contract pricestarted to stabilize in November.Although PC demand remains weak for
2、2H12,production cuts by DRAM makers have contributed to stabilized PCDRAM prices.In light of decelerating supply growth along with fallingutilization rate,we project that PC DRAM prices will likely remain stableuntil the end of 2012,albeit sub-seasonal PC demand.Mobile DRAM supply growth to accelera
3、te price erosion in 1Q13In tandem with solid demand growth from smartphones and tabletscoupled with lackluster demand from PC,major DRAM makers are rapidlyincreasing capacity allocation to mobile DRAM from PC DRAM.SolidRELATED RESEARCH1 October 2012:Asia:Technology:Semiconductors:DRAM:New PC/tablet
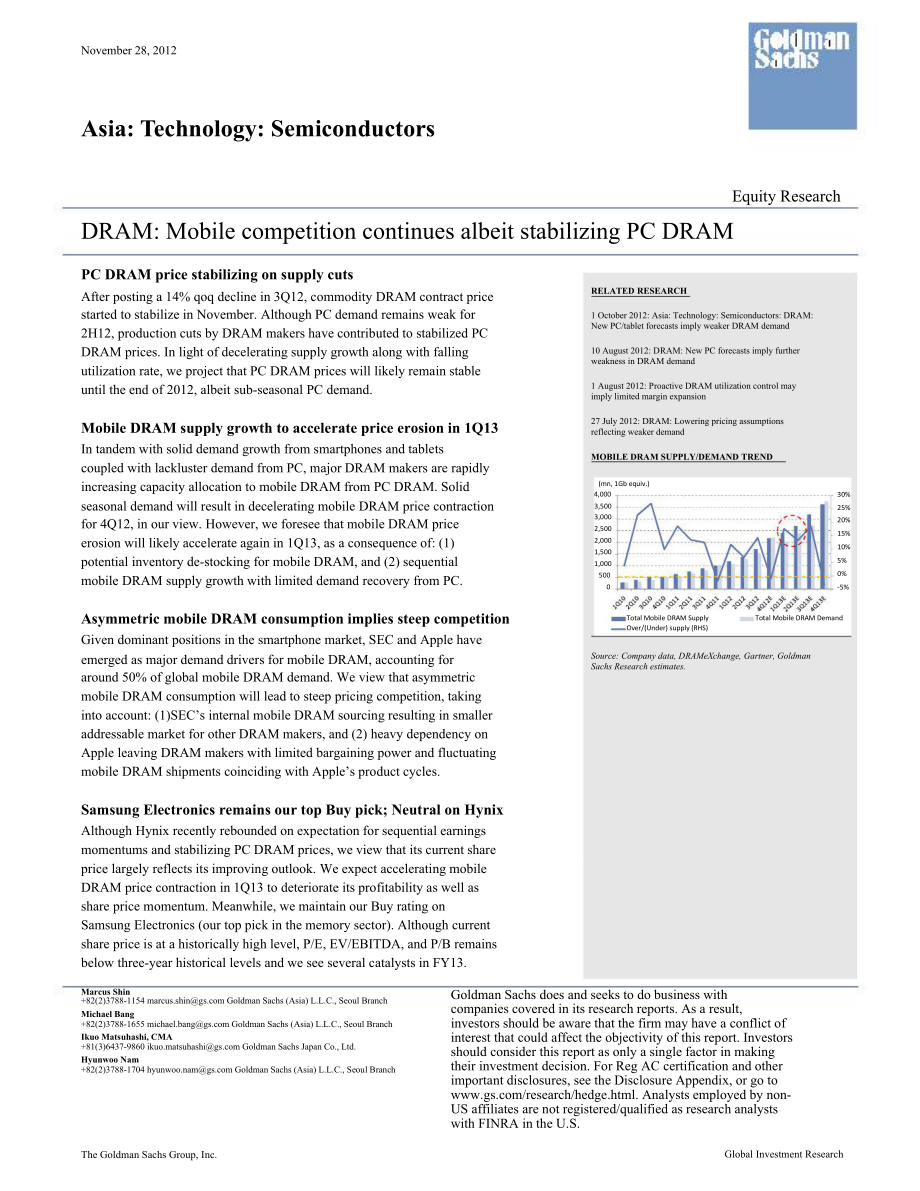
4、forecasts imply weaker DRAM demand10 August 2012:DRAM:New PC forecasts imply furtherweakness in DRAM demand1 August 2012:Proactive DRAM utilization control mayimply limited margin expansion27 July 2012:DRAM:Lowering pricing assumptionsreflecting weaker demandMOBILE DRAM SUPPLY/DEMAND TREND(mn,1Gb eq
5、uiv.)4,000seasonal demand will result in decelerating mobile DRAM price contractionfor 4Q12,in our view.However,we foresee that mobile DRAM priceerosion will likely accelerate again in 1Q13,as a consequence of:(1)potential inventory de-stocking for mobile DRAM,and(2)sequentialmobile DRAM supply grow
6、th with limited demand recovery from PC.Asymmetric mobile DRAM consumption implies steep competitionGiven dominant positions in the smartphone market,SEC and Apple have3,5003,0002,5002,0001,5001,0005000Total Mobile DRAM SupplyOver/(Under)supply(RHS)Total Mobile DRAM Demand25%20%15%10%5%0%5%emerged a
7、s major demand drivers for mobile DRAM,accounting foraround 50%of global mobile DRAM demand.We view that asymmetricmobile DRAM consumption will lead to steep pricing competition,takinginto account:(1)SECs internal mobile DRAM sourcing resulting in smalleraddressable market for other DRAM makers,and(
8、2)heavy dependency onApple leaving DRAM makers with limited bargaining power and fluctuatingmobile DRAM shipments coinciding with Apples product cycles.Samsung Electronics remains our top Buy pick;Neutral on HynixAlthough Hynix recently rebounded on expectation for sequential earningsmomentums and s
9、tabilizing PC DRAM prices,we view that its current shareprice largely reflects its improving outlook.We expect accelerating mobileDRAM price contraction in 1Q13 to deteriorate its profitability as well asshare price momentum.Meanwhile,we maintain our Buy rating onSamsung Electronics(our top pick in
10、the memory sector).Although currentshare price is at a historically high level,P/E,EV/EBITDA,and P/B remainsbelow three-year historical levels and we see several catalysts in FY13.Source:Company data,DRAMeXchange,Gartner,GoldmanSachs Research estimates.Marcus Shin+82(2)3788-1154 Goldman Sachs(Asia)L
11、.L.C.,Seoul BranchMichael Bang+82(2)3788-1655 Goldman Sachs(Asia)L.L.C.,Seoul BranchIkuo Matsuhashi,CMA+81(3)6437-9860 Goldman Sachs Japan Co.,Ltd.Hyunwoo Nam+82(2)3788-1704 Goldman Sachs(Asia)L.L.C.,Seoul BranchThe Goldman Sachs Group,Inc.Goldman Sachs does and seeks to do business withcompanies co
12、vered in its research reports.As a result,investors should be aware that the firm may have a conflict ofinterest that could affect the objectivity of this report.Investorsshould consider this report as only a single factor in makingtheir investment decision.For Reg AC certification and otherimportan
13、t disclosures,see the Disclosure Appendix,or go employed by non-US affiliates are not registered/qualified as research analystswith FINRA in the U.S.Global Investment Research2November 28,2012Asia:Technology:SemiconductorsPC DRAM price stabilizing on supply cutsAfter posting a 14%qoq decline in 3Q12
14、,commodity DRAM contract price started tostabilize in November.According to DRAMeXchange,2Gb DDR3 remained flat at$0.83 inthe first half of November 2012.Along with stabilizing prices,the price gap betweencontract and spot prices has narrowed substantially.Exhibit 1:DDR3 2Gb pricing trend(US$)2.502.
15、302.101.901.701.501.301.100.900.700.50Exhibit 2:DDR3 2Gb contract price premium vs.spot50%40%30%20%10%0%-10%-20%-30%2Gb eTTSource:DRAMeXchange2Gb 1333MHz spotDDR3 2Gb 1333MHz contractDDR3 2Gb 1333MHz contract price premium vs.spotSource:DRAMeXchangeAlthough PC demand remains weak despite favorable s
16、easonality for 2H12,production cutsby DRAM makers have contributed to stabilized PC DRAM prices,in our view.As aconsequence of lackluster PC demand as well as ongoing price erosion,less costcompetitive DRAM makers started to lower utilization rate in 2H12.Our bottom-up analysissuggests that global D
17、RAM capacity will likely decline 8%to 1.06mn WPM(12-inchequivalent)in 4Q12 from 1.15mn WPM in 2Q12.Exhibit 3:Global DRAM capacity trend(K wafer/m)1,8001,6001,4001,20030%20%8%1,00080060040020001Q084Q083Q092Q101Q114Q113Q122Q13ESamsungNanyaSK HynixPowerchipMicronProMosElpidaOthersNote:We are Not Covere
18、d on Nanya,Powerchip,ProMos and Elpida.Estimates for NC companies are based onDRAMeXchange and Gartner data.Source:Company data,DRAMeXchange,Gartner,Goldman Sachs Research estimates.Goldman Sachs Global Investment Research3November 28,2012Asia:Technology:SemiconductorsIn light of decelerating supply
19、 growth along with falling utilization rate,we project that PCDRAM price will likely remain stable until the end of 2012,albeit sub-seasonal PC demand.Mobile DRAM supply growth to accelerate price erosion in 1Q13Contrary to ongoing weakness in PC DRAM demand,mobile DRAM demand continues toincrease r
20、apidly with strong smartphone and tablet shipment growth.As per our estimates,global mobile DRAM demand will likely surge by 99%yoy in 2012,followed by an 80%yoygrowth in 2013E.Exhibit 4:Mobile DRAM demand trend(mn,1Gb equiv.)4,0003,5003,0002,5002,0001,5001,000500060%50%40%30%20%10%0%-10%-20%1Q10 3Q
21、10 1Q11Basic/Feature phoneTabletOthers3Q111Q123Q12 1Q13E 3Q13ESmartphonePMP/Portable Game PlayersChang qoq(RHS)Source:Company data,Gartner,DRAMeXchange,Goldman Sachs Research estimates.In tandem with solid demand growth from smartphones and tablets coupled with lacklusterdemand from PC,major DRAM ma
22、kers are rapidly increasing capacity allocation to mobileDRAM from PC DRAM.In terms of bit shipment,mobile DRAM will likely represent 29%ofglobal DRAM supply in 4Q12,surging from 17%in 4Q11.Along with incremental capacityallocation,mobile DRAM supply will keep increasing rapidly.We estimate that glo
23、balmobile DRAM shipment will increase 28%qoq in 4Q12,following a 24%qoq growth in3Q12.Goldman Sachs Global Investment Research4Q12E1Q13E 2Q13E3Q13E 4Q13E1Q10 2Q10 3Q10 4Q10 1Q11 2Q11 3Q11 4Q11 1Q12 2Q12 3Q124November 28,2012Exhibit 5:Mobile DRAM bit portion trend60%Asia:Technology:SemiconductorsExhi
24、bit 6:Mobile DRAM supply trend(mn,1Gb equiv.)4,00040%50%40%30%20%10%0%3,5003,0002,5002,0001,5001,000500035%30%25%20%15%10%5%0%-5%1Q10 3Q10 1Q11Samsung3Q11 1Q12Hynix3Q12 1Q13E 3Q13EElpidaIndustry average.SamsungHynixElpidaMicronMicronChang qoq(RHS)NanyaWinbondNote:We are Not Covered on Elpida.Estimat
25、es for NC companies are basedon DRAMeXchange and Gartner data.Source:Company data,DRAMeXchange,Gartner,Goldman Sachs Researchestimates.Note:We are Not Covered on Nanya,Elpida and Winbond.Estimates for NCcompanies are based on DRAMeXchange and Gartner data.Source:Company data,DRAMeXchange,Gartner,Gol
26、dman Sachs Researchestimates.Despite substantial supply growth,decreasing mobile DRAM pricing trend will deceleratein 4Q12(around 5-10%qoq decline for 4Q12 vs.10%+qoq declines for the past fewquarters),chiefly on account of solid demand from smartphone and tablet.Due to seasonaldownturn in demand,ho
27、wever,we project that mobile DRAM demand will sequentiallydecline along with potential mobile DRAM inventory de-stocking in 1Q13.On the flip side,mobile DRAM supply will continue to grow in 1Q13 with limited demand recovery from PC.As such,we expect mobile DRAM price contraction to accelerate again
28、in 1Q13,pressurizing DRAM makers profitability.Exhibit 7:Mobile DRAM supply/demand trend(mn,1Gb equiv.)4,0003,5003,0002,5002,0001,5001,0005000Total Mobile DRAM SupplyTotal Mobile DRAM Demand30%25%20%15%10%5%0%5%Over/(Under)supply(RHS)Source:Company data,DRAMeXchange,Gartner,Goldman Sachs Research es
29、timates.Goldman Sachs Global Investment Research4Q12E 1Q13E 2Q13E 3Q13E 4Q13E1Q102Q103Q104Q101Q112Q113Q114Q111Q122Q123Q125November 28,2012Asia:Technology:SemiconductorsAsymmetric mobile DRAM consumptions imply steep competitionIn the global smartphone market,Samsung Electronics(SEC)and Apple(AAPL,Bu
30、y,on CL,US$589.53;covered by Bill Shope)continue to lead the market,commanding dominantshares.Accordingly,mobile DRAM demand from SEC and Apple kept increasing rapidly aswell.As per our estimates,mobile DRAM demand from SEC and Apple including bothsmartphones and tablets will reach 1.9bn units and 1
31、.1bn units(on a 1Gb equivalent basis)for 2012,representing 31%and 18%of global mobile DRAM demand,respectively.Exhibit 8:Mobile DRAM demand from SEC and Apple as%of total60%50%40%30%20%10%0%Demand from Samsung&AppleDemand from SamsungDemand from AppleSource:Company data,Goldman Sachs Research estima
32、tes.Given that SECs smartphone and tablet supply chain is vertically integrated fromsemiconductors such as mobile DRAM,NAND,and AP to other components includingdisplay and battery,SEC mostly sources its mobile DRAM internally.In addition,as aconsequence of ongoing patent litigation,Apple has substan
33、tially lowered its proportion ofmobile DRAM procurement from SEC.In our view,these factors pose structural challengesfor major DRAM makers from two perspectives.Firstly,with SEC mostly procuring its mobile DRAM for smartphones and tablets internally,other DRAM makers such as Hynix and Elpida(6665.T,
34、Not Covered)/Micron(MU,NotRated;covered by James Schneider)inherently have very limited exposure to SECs mobileDRAM supply chains.As such,we view that SECs internal mobile DRAM sourcing willcontinue to leave a smaller addressable market for other DRAM makers,which will result inintensifying price co
35、mpetition so as to gain more share within the remaining mobile DRAMmarket.Goldman Sachs Global Investment Research6November 28,2012Exhibit 9:Mobile DRAM supply/demand mapAsia:Technology:SemiconductorsMobile DRAM demand(2012E)51%18%31%Major Suppliers Samsung,Hynix,Elpida,Micron,Winbond,NanyaHynix and
36、 ElpidaMostly SamsungSamsungAppleOthersNote:We are Not Covered on Nanya,Winbond and Elpida.Estimates for NC companies are based on DRAMeXchange andGartner data.Source:DRAMeXchange,Gartner,Goldman Sachs Research estimates.Secondly,we view that Apples dominant shares in the mobile DRAM demand will lea
37、veDRAM makers with limited bargaining power as well as fluctuating shipment trends.Weestimate that Apple represents approximately 25%-30%of global mobile DRAM demandexcluding SEC.As Hynix and Elpida/Micron have to largely rely on mobile DRAM shipmentfrom a single customer,we project that those DRAM
38、makers will have limited bargainingpower in terms of pricing.On top of it,due to their heavy dependency on Apples demand,their mobile DRAM shipment will likely move in line with Apples product cycles,resultingin substantial fluctuations in mobile DRM shipment.Exhibit 10:Mobile DRAM demand from Apple
39、(mn,1Gb equiv.)9008007006005004003002001000140%120%100%80%60%40%20%0%-20%1Q103Q101Q113Q111Q123Q12 1Q13E 3Q13EFrom Apple handsetsFrom Apple tabletsChange qoq(RHS)Source:Company data,Goldman Sachs Research estimates.Goldman Sachs Global Investment Research7November 28,2012Asia:Technology:Semiconductor
40、sSamsung Electronics remains our top Buy pick;Neutral on HynixAs a consequence of:(1)stabilizing PC DRAM pricing trends,(2)robust rebound in NANDprice,and(3)expectation for sequential earnings momentum from 4Q12,Hynixs shareshave exhibited solid upward momentum,rebounding about 27%from its recent bo
41、ttom(W20,250 in July 2012)vs.KOSPIs 6%.Trading at 17X P/E and 1.6X P/B with ROE of 8%forFY13E,however,its current share price mostly reflects improving earnings outlook,in ourview.On top of that,we project that accelerating mobile DRAM price contraction in 1Q13will potentially deteriorate its profit
42、ability as well as any upward share price momentum.Hence,we remain Neutral on Hynix.Exhibit 11:Hynixs forward P/B(X)3.53.0Exhibit 12:Hynixs historical ROE trend60%40%2.52.020%0%-20%Historical avg.=10%1.51.0Historical avg.=1.6x-40%-60%-80%0.520042006ROE20082010 2012EHistorical average2014E0.0Jan-04Ja
43、n-05Jan-06Jan-07Jan-08Jan-09Jan-10Jan-11Jan-12Hynix 1-yr fwd P/BHistorical averageSource:Company data,Goldman Sachs ResearchSource:Company data,Goldman Sachs Research estimates.Meanwhile,we maintain our Buy rating on SEC.Although current share price is at ahistorically high level,P/E,EV/EBITDA,and P
44、/B remains below the three-year historicallevel and we see several catalysts in FY13 such as firm smartphone operations andimprovements from the NAND,System LSI,Display Panel,and tablet businesses.As such,SEC remains our top Buy pick in the memory sector.Exhibit 13:Samsung Electronics P/B band(W)1,6
45、00,0001,400,0001,200,0001,000,000800,000600,000400,000200,0000Jan-00 Jan-01 Jan-02 Jan-03 Jan-04 Jan-05 Jan-06 Jan-07 Jan-08 Jan-09 Jan-10 Jan-11 Jan-12 Jan-13Exhibit 14:Samsung Electronics EV/EBITDA band(W)1,600,0001,400,0001,200,0001,000,000800,000600,000400,000200,0000Jan-00 Jan-01 Jan-02 Jan-03
46、Jan-04 Jan-05 Jan-06 Jan-07 Jan-08 Jan-09 Jan-10 Jan-11 Jan-12 Jan-13Price1X1.5X2X2.5X3XPrice3X4.5X6X7.5X9XSource:Company data,Goldman Sachs Research estimates.Goldman Sachs Global Investment ResearchSource:Company data,Goldman Sachs Research estimates.8November 28,2012Asia:Technology:Semiconductors
47、Rating and pricing informationSamsung Electronics(B/A,W1,404,000)and SK Hynix Inc.(N/A,W25,800)Goldman Sachs Global Investment Research9November 28,2012Asia:Technology:SemiconductorsDisclosure AppendixReg ACI,Marcus Shin,hereby certify that all of the views expressed in this report accurately reflec
48、t my personal views about the subject company orcompanies and its or their securities.I also certify that no part of my compensation was,is or will be,directly or indirectly,related to the specificrecommendations or views expressed in this report.Investment ProfileThe Goldman Sachs Investment Profil
49、e provides investment context for a security by comparing key attributes of that security to its peer group andmarket.The four key attributes depicted are:growth,returns,multiple and volatility.Growth,returns and multiple are indexed based on compositesof several methodologies to determine the stock
50、s percentile ranking within the regions coverage universe.The precise calculation of each metric may vary depending on the fiscal year,industry and region but the standard approach is as follows:Growth is a composite of next years estimate over current years estimate,e.g.EPS,EBITDA,Revenue.Return is
51、 a year one prospective aggregateof various return on capital measures,e.g.CROCI,ROACE,and ROE.Multiple is a composite of one-year forward valuation ratios,e.g.P/E,dividendyield,EV/FCF,EV/EBITDA,EV/DACF,Price/Book.Volatility is measured as trailing twelve-month volatility adjusted for dividends.Quan
52、tumQuantum is Goldman Sachs proprietary database providing access to detailed financial statement histories,forecasts and ratios.It can be used forin-depth analysis of a single company,or to make comparisons between companies in different sectors and markets.GS SUSTAINGS SUSTAIN is a global investme
53、nt strategy aimed at long-term,long-only performance with a low turnover of ideas.The GS SUSTAIN focus listincludes leaders our analysis shows to be well positioned to deliver long term outperformance through sustained competitive advantage andsuperior returns on capital relative to their global ind
54、ustry peers.Leaders are identified based on quantifiable analysis of three aspects of corporateperformance:cash return on cash invested,industry positioning and management quality(the effectiveness of companies management of theenvironmental,social and governance issues facing their industry).Disclo
55、suresCoverage group(s)of stocks by primary analyst(s)Marcus Shin:Asia Pacific Chemicals,Korea Technology.Asia Pacific Chemicals:Cheil Industries,Far Eastern New Century Corp.,Formosa Chemicals&Fibre,Formosa Plastics,Hanwha Chemical,HonamPetrochemical,KP Chemical,Kumho Petro Chemical Co.,LG Chem,Nan
56、Ya Plastics,PTT Global Chemical,Petronas Chemicals Group Berhad,TaiwanFertilizer,Tata Chemicals,United Phosphorus.Korea Technology:Asia Pacific Systems,Iljin Materials,LG Display,LG Electronics,LG Innotek Co.,SFA Engineering,SK Hynix Inc.,Samsung Electro-Mechanics,Samsung Electronics,Samsung SDI Co.
57、,Samsung Techwin,Seoul Semiconductor,Soulbrain.Company-specific regulatory disclosuresThe following disclosures relate to relationships between The Goldman Sachs Group,Inc.(with its affiliates,Goldman Sachs)and companiescovered by the Global Investment Research Division of Goldman Sachs and referred
58、 to in this research.Goldman Sachs has received compensation for investment banking services in the past 12 months:Samsung Electronics(W1,416,000)Goldman Sachs expects to receive or intends to seek compensation for investment banking services in the next 3 months:Samsung Electronics(W1,416,000)Goldm
59、an Sachs had an investment banking services client relationship during the past 12 months with:Samsung Electronics(W1,416,000)Goldman Sachs had a non-investment banking securities-related services client relationship during the past 12 months with:Samsung Electronics(W1,416,000)Goldman Sachs Global
60、Investment Research10November 28,2012Asia:Technology:SemiconductorsGoldman Sachs had a non-securities services client relationship during the past 12 months with:Samsung Electronics(W1,416,000)Goldman Sachs(Asia)L.L.C.,Seoul Branch beneficially owned 0 Equity Linked Warrants which has the companys s
61、tock as the underlier as of theclose of business two business days prior to the current date for which it is acting as a liquidity provider:HANA DAETOO SECURITIES CO.,LTD.1346SAMSUNG ELECTRONICS CO.,LTD.CALL.Goldman Sachs(Asia)L.L.C.,Seoul Branch beneficially owned 0 Equity Linked Warrants which has
62、 the companys stock as the underlier as of theclose of business two business days prior to the current date for which it is acting as a liquidity provider:HANA DAETOO SECURITIES CO.,LTD.1212SAMSUNG ELECTRONICS CO.,LTD.CALL.Goldman Sachs(Asia)L.L.C.,Seoul Branch beneficially owned 0 Equity Linked War
63、rants which has the companys stock as the underlier as of theclose of business two business days prior to the current date for which it is acting as a liquidity provider:HANA DAETOO SECURITIES CO.,LTD.1213SAMSUNG ELECTRONICS CO.,LTD.CALL.Goldman Sachs(Asia)L.L.C.,Seoul Branch beneficially owned 0 Eq
64、uity Linked Warrants which has the companys stock as the underlier as of theclose of business two business days prior to the current date for which it is acting as a liquidity provider:HANA DAETOO SECURITIES CO.,LTD.0065SAMSUNG ELECTRONICS CO.,LTD.CALL.Goldman Sachs(Asia)L.L.C.,Seoul Branch benefici
65、ally owned 0 Equity Linked Warrants which has the companys stock as the underlier as of theclose of business two business days prior to the current date for which it is acting as a liquidity provider:HANA DAETOO SECURITIES CO.,LTD.0087SAMSUNG ELECTRONICS CO.,LTD.CALL.Goldman Sachs(Asia)L.L.C.,Seoul
66、Branch beneficially owned 0 Equity Linked Warrants which has the companys stock as the underlier as of theclose of business two business days prior to the current date for which it is acting as a liquidity provider:HANA DAETOO SECURITIES CO.,LTD.1278SAMSUNG ELECTRONICS CO.,LTD.CALL.Goldman Sachs(Asia)L.L.C.,Seoul Branch beneficially owned 0 Equity Linked Warrants which has the companys stock as the underlier as of theclose of business two business days prior to the current date for which it is a
- 温馨提示:
1: 本站所有资源如无特殊说明,都需要本地电脑安装OFFICE2007和PDF阅读器。图纸软件为CAD,CAXA,PROE,UG,SolidWorks等.压缩文件请下载最新的WinRAR软件解压。
2: 本站的文档不包含任何第三方提供的附件图纸等,如果需要附件,请联系上传者。文件的所有权益归上传用户所有。
3.本站RAR压缩包中若带图纸,网页内容里面会有图纸预览,若没有图纸预览就没有图纸。
4. 未经权益所有人同意不得将文件中的内容挪作商业或盈利用途。
5. 装配图网仅提供信息存储空间,仅对用户上传内容的表现方式做保护处理,对用户上传分享的文档内容本身不做任何修改或编辑,并不能对任何下载内容负责。
6. 下载文件中如有侵权或不适当内容,请与我们联系,我们立即纠正。
7. 本站不保证下载资源的准确性、安全性和完整性, 同时也不承担用户因使用这些下载资源对自己和他人造成任何形式的伤害或损失。
最新文档
- 七年级数学:平面直角坐标系中不规则图形面积的计算课件
- 地理环境的差异性课件——曲靖市麒麟区第一中学-郭金涛1
- 高考数学文科一轮复习(北京卷B)ppt课件102双曲线及其性质
- 剖宫产瘢痕妊娠课件
- 七年级《走进初中-享受学习》主题班会ppt课件
- 2020高端楼盘营销渠道拓客课件
- 七年级道德与法治下册第四单元走进法治天地第九课法律在我们身边第1框生活需要法律ppt课件2新人教版
- 七年级生物血管和心脏课件
- 高考数学一轮复习讲义-第一章-1.2-命题及其关系、充分条件与必要条件ppt课件
- 2021公司元旦跨年预售活动方案课件
- 高考数学一轮复习-第十八章-第2讲-极坐标与参数方程ppt课件-文
- 高考数学一轮复习-第二章第四节-幂函数与二次函数ppt课件-理-(广东专用)
- 北欧家具设计课件
- 高考数学一轮复习5.35特殊数列求和ppt课件理
- 高考数学浙江专用二轮培优ppt课件专题六第1讲排列组合二项式定理
