 北大暑期课程《回归分析》(Linear-Regression-Analysis)讲义PKU7

《北大暑期课程《回归分析》(Linear-Regression-Analysis)讲义PKU7》由会员分享,可在线阅读,更多相关《北大暑期课程《回归分析》(Linear-Regression-Analysis)讲义PKU7(6页珍藏版)》请在装配图网上搜索。
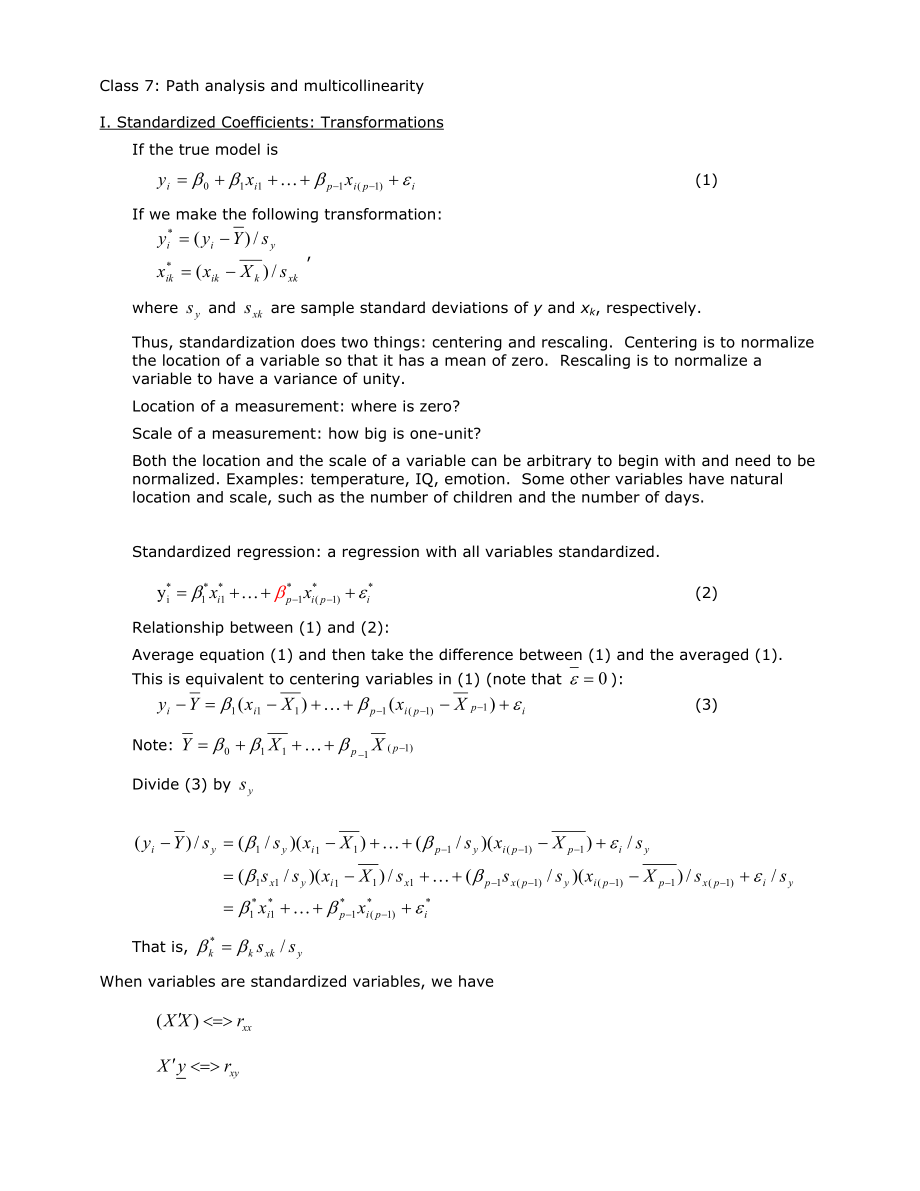
1、Class 7: Path analysis and multicollinearity I. Standardized Coefficients: TransformationsIf the true model is (1)If we make the following transformation: ,where and are sample standard deviations of y and xk, respectively.Thus, standardization does two things: centering and rescaling. Centering is
2、to normalize the location of a variable so that it has a mean of zero. Rescaling is to normalize a variable to have a variance of unity. Location of a measurement: where is zero?Scale of a measurement: how big is one-unit? Both the location and the scale of a variable can be arbitrary to begin with
3、and need to be normalized. Examples: temperature, IQ, emotion. Some other variables have natural location and scale, such as the number of children and the number of days. Standardized regression: a regression with all variables standardized. (2)Relationship between (1) and (2):Average equation (1)
4、and then take the difference between (1) and the averaged (1). This is equivalent to centering variables in (1) (note that ): (3)Note: Divide (3) by That is, When variables are standardized variables, we have.In the older days of sociology (1960s and 1970s), many studies publish correlation matrices
5、 so that their regression results can be easily replicated. This is possible because correlation matrices contain all the sufficient statistics for path analysis. II. Why Standardized Coefficients?A. Ease of ComputationB. Boundaries of Estimates: -1 to 1.C. Standardized Scale in ComparisonWhich is b
6、etter: Standardized or UnstandardizedUnstandardized coefficients are generally better because they tell you more about the data and about changes in real units. Rule of Thumb:A. Usually it is not a good idea to report standardized coefficients. B. Almost always report unstandardized coefficients (if
7、 you can).C. Read standardized coefficients on your own.D. You can interpret unstandardized coefficients in terms of standard deviations. (homework).E. If only a correlation matrix is available, then only standardized coefficients can be estimated (LISREL). F. In an analysis of comparing multiple po
8、pulations, whether to use standardized or unstandardized is consequential. In this case, theoretical/conceptual considerations should dictate the decision. III. Decomposition of Total Effects A. Difference between reduced-form equations and structural equationsEverything I am now discussing is about
9、 systems of equations. What are systems of equations? Systems of equations are equations with different dependent variables. For example, we talked about auxiliary regressions: one independent variable is turned into the new dependent variable. 1. Exogenous variablesExogenous variables are variables
10、 that are used only as independent variables in all equations. 2. Endogenous variablesEndogenous variables are variables that are used as dependent variables in some equations and may be used as independent variables in other equations. B. Structural Equations versus Reduced Forms1. Structural Equat
11、ionsStructural equations are theoretically derived equations that often have endogenous variables as independent variables.2. Reduced FormsReduced form equations are equations in which all independent variables are exogenous variables. In other words, in reduced form equations, we purposely ignore i
12、ntermediate (or relevant) variables. C. Types of EffectsTotal effects can be decomposed into two parts: direct effects and indirect effects.A famous example is drawn from Blau and Duncan model of status attainment:XFathersocc.516V.310.394.859.818.753.115.440Respondents educationUOcc. In 1962Y.281W.2
13、79First jobFatherseducation.2241. Total EffectA total effect can be defined as the effect in the reduced form equations. In the example, what is the total effects of fathers education and fathers occupation on sons occupation:You run a regression of sons occupation on fathers education and fathers o
14、ccupation. The estimated coefficients are total effects.2. Direct EffectDirect effects can be defined as the effects in the structural equations. In our example, the direct effect of fathers education is zero by assumption, which is subject to testing. The direct effect of fathers occupation on sons
15、 occupation is estimated in the model regression sons occupation on sons education and fathers occupation.3. Indirect EffectThe indirect effect works through an intermediate variable. It is usually the product of two coefficients. In our example, the indirect effect of fathers education on sons occu
16、pation is the product of the effect of fathers education on sons education and the effect of sons education on sons occupation. This is the same as the auxiliary regression before. The total effect is the sum of the direct effect and the indirect effect. This result is consistent with our earlier di
17、scussion of omitted variables. How do we calculate the total effect? It should be the direct effect plus the indirect effect. It has the same formula as the one we discussed in connection with auxiliary regressions. Total effect =Direct Effect +Indirect EffectIV. Problem of MulticollinearityA. Assum
18、ption about the singularity of .Recall that the first assumption for the least squares estimator is that is nonsingular. What is meant by that is that none of the columns in the X matrix is a linear combination of other columns in. Why do we need the assumption? Because without the assumption, we ca
19、nnot take the inverse of for . Why do we use the word multicollinearity instead of collinearity? joke multi is a trendy word: multimillionaires, multi-national, and multiculturalism. Answer: linear combinations of several variables. We cannot determine whether there is a problem of collinearity from
20、 correlations. B. Examples of Perfect Multicollinearity.1. If includes 1, we cannot include other variables that do not change across all observations. 2. We cannot include parents education after we include mother and fathers education in the model separately.C. Identification ProblemContrary to co
21、mmon misunderstandings, multicollinearity does not cause bias. It is an identification problem. D. Empirical Under-identificationEven though the model is identified theoretically, the data may be so thin that it is under-identified empirically. Rather than “yes-no,” the under-identification is a mat
22、ter of degree. Thus, we would like to have a way to quantify the degree of under-identification. Root of the problem: less information. Empirical under-identification problem can often be overcome by collecting more data. Under-identification = less efficiency = reduction in effective number of case
23、s. Thus, increase of sample size compensates for under-identification. E. Consequences of MulticollinearityIn the presence of multicollinearity, the estimates are not biased. Rather, they are unstable or having large standard errors. If through the computer output gives you small standard errors of
24、the estimates, do not worry about the multicollinearity problem. This is important, but often misunderstood. V. Variance Inflation FactorReview of partial regression estimation: True regression:In matrix:This model can always be written into:(1) where now are matrices of dimensions and are parameter
25、 vectors, of dimensions .We first want to prove that regression equation (1) is equivalent to the following procedure:(1) Regress , obtain residuals ; (2) Regress , obtain residuals ;(3) Then regress on , and obtain the correct least squares estimates of (=), same as those from the one-step method.W
26、ithout loss of generality, say that the last independent variable is singled out. That is, make , make . From the above result, we can estimate from,where and are respectively residuals of the regressions of and on .(both and have zero means).There is no intercept term because was contained in (so t
27、hat and are centered around zero). From the formulas for simple regression:Variance Inflation Factor VIF is defined as:Similar results apply to other independent variables.VIF is inversely related to in the auxiliary regression of an independent variable on all other independent variables. VIF measu
28、res the reduction in the information in an independent variable due to its linear dependency on other independent variables. In other words, it is the reduction factor associated with the variance of the LS estimator () after we include other independent variables in the model. If an independent variable were orthogonal to other variables in the model, the sampling variance of the estimator of its coefficient would remain the same as the case under simple regression. This is another reason why we cannot increase the number of independent variables infinitely.
- 温馨提示:
1: 本站所有资源如无特殊说明,都需要本地电脑安装OFFICE2007和PDF阅读器。图纸软件为CAD,CAXA,PROE,UG,SolidWorks等.压缩文件请下载最新的WinRAR软件解压。
2: 本站的文档不包含任何第三方提供的附件图纸等,如果需要附件,请联系上传者。文件的所有权益归上传用户所有。
3.本站RAR压缩包中若带图纸,网页内容里面会有图纸预览,若没有图纸预览就没有图纸。
4. 未经权益所有人同意不得将文件中的内容挪作商业或盈利用途。
5. 装配图网仅提供信息存储空间,仅对用户上传内容的表现方式做保护处理,对用户上传分享的文档内容本身不做任何修改或编辑,并不能对任何下载内容负责。
6. 下载文件中如有侵权或不适当内容,请与我们联系,我们立即纠正。
7. 本站不保证下载资源的准确性、安全性和完整性, 同时也不承担用户因使用这些下载资源对自己和他人造成任何形式的伤害或损失。
