 Continuous GPS Monitoring of Structural Deformation at Pacoima Dam

《Continuous GPS Monitoring of Structural Deformation at Pacoima Dam》由会员分享,可在线阅读,更多相关《Continuous GPS Monitoring of Structural Deformation at Pacoima Dam(10页珍藏版)》请在装配图网上搜索。
1、Monitoring Structural Deformation at Pacoima Dam, California Using Continuous GPSJeffrey A. Behr, Southern California Earthquake Center, SCIGN-USGSKenneth W. Hudnut and Nancy E. King, United States Geological SurveyBIOGRAPHYJeffrey A. Behr is Systems Specialist for the Southern California Integrated
2、 GPS Network (SCIGN). His present responsibilities include the development of software and systems for network communications, processing and analysis for the developing 250-station array, with emphasis on SCIGNs near-real-time earthquake response capability. He received his M. Sc. degree in Geologi
3、cal Sciences from the University of Colorado, Boulder, in 1992 and has been working in continuous GPS since 1993.Kenneth W. Hudnut is a Geophysicist with the United States Geological Survey in Pasadena. He is a member of the SCIGN executive committee, vice chair of the SCIGN coordinating board and c
4、hairs the crustal deformation working group of the Southern California Earthquake Center. He received his Ph.D. in Geology from Columbia University in 1989.Nancy King is a Geophysicist with the United States Geological Survey at USGS-Pasadena and is a member of the SCIGN Coordinating Board. She rece
5、ived her Ph.D. in Geophysics from the Scripps Institution of Oceanography in 1990.ABSTRACTAgencies responsible for dam safety have long used conventional surveying methods to measure the displacements of benchmarks as part of dam monitoring programs. Such surveys have provided infrequent though prec
6、ise estimates of a dams motions. With the development of high precision GPS methods to monitor plate tectonic motions and crustal deformation rates, an alternative method for monitoring such structural motions became available. While high- precision GPS approaches the horizontal positioning capabili
7、ty of conventional surveying methods, its great benefit lies in a much higher temporal resolution and nearly unattended continuous operation. In September 1995, Pacoima Dam, located in the San Gabriel Mountains north of Los Angeles, California, was instrumented with a triad of continuously operating
8、 GPS receivers to test the feasibility of applying these techniques to the field of structural monitoring. Nearly three years of data have been analyzed from this sub-array to provide quarter-daily estimates of station-to-station baseline lengths. Quantitative methods were assessed to allow the iden
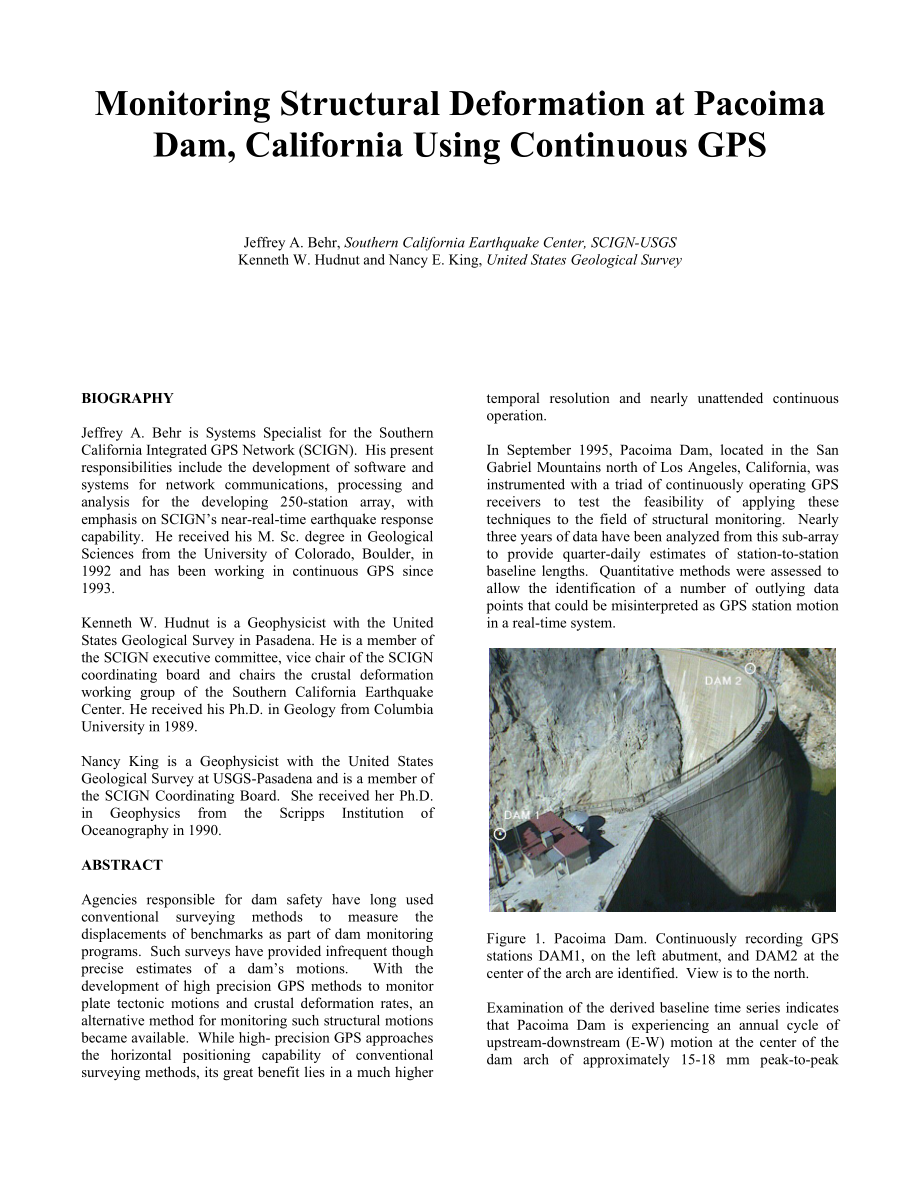
9、tification of a number of outlying data points that could be misinterpreted as GPS station motion in a real-time system. Figure 1. Pacoima Dam. Continuously recording GPS stations DAM1, on the left abutment, and DAM2 at the center of the arch are identified. View is to the north.Examination of the d
10、erived baseline time series indicates that Pacoima Dam is experiencing an annual cycle of upstream-downstream (E-W) motion at the center of the dam arch of approximately 15-18 mm peak-to-peak amplitude. Comparison of motion to daily regional temperature records strongly indicates that the dam respon
11、ds to annual and shorter-period ambient temperature variations. Spectral methods are used to model this relationship to allow a more accurate estimation of the thermoelastic behavior of the structure. INTRODUCTIONIn coordination with the application of continuous GPS to crustal deformation monitorin
12、g in the L. A. Basin, the U. S. Geological Survey and Los Angeles County embarked in 1995 on an open-ended program to continuously monitor the positions of 2 points on Pacoima Dam, California (Figure 1). This structure (at 113 m, the tallest dam in the world at the time of its completion in 1929) ex
13、perienced severe shaking (1 g) and significant damage during the 1971 San Fernando and 1994 Northridge earthquakes (Swanson and Sharma, 1979; USGS and SCEC Scientists, 1994). On September 1, 1995, two monuments on the dam and another at the U. S. Forest Services Fire Camp 9, 2.5 km to the NW (Figure
14、 2), were instrumented with dual-frequency P-code GPS receivers and incorporated into the Los Angeles Basins Dense GPS Geodetic Array. The design of this system, its communications and operations are based directly on that of the Permanent GPS Geodetic Array, the forerunner of SCIGN (Bock et al., 19
15、97).Figure 2. Location Map. In addition to stations DAM1 and DAM2, CMP9 station is less than 3 km away from Pacoima Dam. Data from three other SCIGN stations (ROCK, LEEP and CHIL) were also used in this study.Pacoima Dam trends a few degrees west of north (abutment to abutment) in an east-west runni
16、ng section of steep-walled Pacoima Canyon. Station DAM1 was installed on the roof of a single-story, concrete operations building on the south (left) thrust block of the dam. Station DAM2 was installed near the center of the concrete arch atop a 2 m tall steel-tube monument (Figure 3). These station
17、s form a 103.7-m baseline differing in height by only 0.66 m. Station CMP9 sits atop a ridge approximately 2.5 km distant, more than 550 m above the dams crest (Figure 2).Hudnut and Behr (1998) describe the initial 2 years of operation and observations for this system. The highlight of that analysis
18、 was the identification of an oscillatory displacement of the DAM2 station of approximately 17-mm peak-to-peak amplitude with respect to DAM1 with an approximately annual period. The analysis showed that this displacement was strongly related to air temperature records from Burbank, CA., approximate
19、ly 20 km to the south. It also suggested that the dam might be responding to higher frequency temperature variations. However, because the record available for that study was only two-years in length, we were only able to roughly estimate a transfer function between input temperature and output annu
20、al displacement. This paper reexamines this issue with the benefit of an added year of data. In addition, we reanalyzed the data in 6-hour sessions in order to assess the trade-off between decreasing latency and probable decrease in precision using higher-frequency GPS solutions. Figure 3. Station D
21、AM2. The Dorne-Margolin choke ring antenna is mounted on a steel pier, and GPS receiver, modem and power supply are in the NEMA-type enclosure mounted to the fencing.A goal of earthquake response efforts is to obtain and provide rapid, accurate measurements of the locations and amplitudes of signifi
22、cant tilts, strains and displacements following moderate to large earthquakes. At those same times and in much the same way, owners and operators of buildings and engineered structures need prompt, reliable estimates of structural displacements for safety and hazard analysis. But beyond this, contin
23、uously operating GPS, if implemented properly, can provide frequent, precise estimates of structural motions during periods unaffected by seismic motions.GPS currently offers more than one method for structural monitoring applications. Two end-members of these methods might be described as static po
24、st-processing of GPS data (Hudnut & Behr, 1998) and Real-Time Kinematic (RTK) positioning (Celebi et al., 1998). While this paper summarizes our investigation of the first method, RTK methods are being tested at USGS-Pasadena for incorporation into the SCIGN as a supplemental tool for near-real-time
25、 earthquake displacement measurement. We have proposed and hope to implement real-time telemetry of RTK data from Pacoima Dam back to the USGS offices to aid the development of robust RTK systems for both structural monitoring and earthquake response. GPS ANALYSISWe performed quarter-day solutions f
26、or the Pacoima Dam network plus three additional SCIGN stations (ROCK, LEEP and CHIL) for 1059 days from September 1, 1995 to July 26, 1998. These solutions used phase and pseudorange data collected by Ashtech Z-12 dual-frequency, P-code receivers and choke-ring antennae. Precise ephemerides generat
27、ed by the International GPS Service (IGS) (Beutler and Neilan, 1997) and UT1/polar motion estimates provided by the U.S. Naval Observatory (USNO) were used in the solutions. We performed the initial processing of the GPS data using the GAMIT software (King and Bock, 1998). This package prepares the
28、station observation data and IGS ephemeris, then computes the residual observations and partial derivatives from a geometric model. The package then marks and attempts to repair cycle-slips and outliers in the data using various combinations of phase and pseudorange data. Finally, station coordinate
29、s, orbital parameters and phase ambiguities are estimated in a least-squares adjustment. Ambiguity resolution in GAMIT is an iterative process, involving the use of alternating estimations of geodetic parameters, real-valued, and integer biases using several combinations of phase and range data (Fei
30、gl et al., 1993). In short, geodetic parameters and real-valued biases are first estimated for all independent double differences using the ionosphere-free linear combination phase observable (LC). This is followed by estimation of wide-lane biases using independent L1 and L2 data while fixing the L
31、C-derived geodetic parameters and applying appropriate constraints on the ionosphere. GAMIT next forces wide-lane biases to integer values using the decision-function (Dong and Bock, 1989) and the addition of P-code pseudo-range data. With wide-lanes now held fixed, geodetic parameters and L1 biases
32、 are estimated using the LC observations. After the narrow-lane (L1) biases are forced to integer values, again via the decision function, the LC observations are used once more for the final geodetic parameter estimation. This set of geodetic parameters and corresponding variance-covariance matrice
33、s are next processed by the GLOBK Kalman filter adjustment software (Herring, 1998) to provide final quarter-daily estimates for the Pacoima Dam network. At this stage, we defined the reference frame for our analysis by applying a priori constraints of 5 ppb to the IGS orbits and 20 and 40 mm, respe
34、ctively, to the horizontal and vertical coordinates of the two outermost stations of the network (CHIL and ROCK). These constraints are roughly twice the expected errors in these parameters (2-3 ppb for the orbits and 10-20 mm for the coordinates) (Table 1). Nonetheless, they are sufficiently tight
35、that uncertainties in the orbits and the geocentric position of the network contribute less than 1 mm to the uncertainties of the unconstrained baselines in the analysis. TABLE 1. A priori constraints applied in GLOBK. ParametersConstraintsStations20 mm NE, 40 mm Up - CHIL & ROCKSatellites0.10 m XYZ
36、, 0.01 mm/s VxVyVzPole0.25 mas in XY, 0.1 mas/day UT10.25 mas, 0.1 mas/dayGLOBK was developed to combine multiple loosely- constrained solutions - estimates of geodetic parameters and their corresponding covariance matrices - in a single adjustment with uniform application of constraints. It is typi
37、cally used to process global GPS data for the determination of satellite ephemerides, and regional data for the estimation of station velocities over multi-year spans. We use GLOBK primarily to perform a quality check on each independent solution. Poor-quality solutions are automatically rejected in
38、 the final adjustment. It also affords a computationally efficient method for testing various combinations of weights and constraints on the geodetic parameters derived from the GAMIT analysis. For example, once biases had been fixed in GAMIT, we were then able to process the data with varied constr
39、aints on the station coordinates to obtain an overall assessment of the quality of the bias-fixing. PACOIMA DAM DATAFollowing the GLOBK processing, we extracted baseline time series for stations CMP9, DAM1 and DAM2. The time series were then demeaned and examined for jumps in the data due to site di
40、sturbances or equipment failures. Such jumps can strongly bias estimates of crustal velocities and are the subject of focused research in the SCIGN project. One such failure occurred at DAM2 when the original choke-ring antenna failed and was replaced on October 23, 1996 (662 days after January 1, 1
41、995). The magnitude of this offset was estimated by linear least-squares fits to several multi-day spans of pre- and post-jump data from the CMP9-DAM2 and DAM1-DAM2 time series. The final adjustments and one-sigma uncertainties are summarized in Table 2. (Note that these are presented as baseline ch
42、anges, not as absolute station positions.) Estimated uncertainties may be inflated due to a) a gap in the DAM1 time series shortly after the antenna was replaced, and b) our application of a linear fit to a time series with a significant oscillatory signal. Although there are more rigorous methods a
43、vailable to calculate these offsets, we did not consider them necessary for this analysis. It is apparent, however, that this adjustment provides some indication of the short-period detection threshold of the system in that we are able to observe horizontal displacements on the order of 4 mm on the
44、107-m baseline from DAM1-DAM2. Table 2. DAM2 antenna change offsets in mm.Baseline to:NorthEastUpLengthCMP9 offsetCMP9 sigmaDAM1 offsetDAM1 sigmaOUTLIER REJECTIONNot unexpectedly, the use of quarter-day solutions resulted in higher standard errors in the baseline estimates than daily processing, as
45、well as several significant outliers in the time series. If the data were being examined as part of a real-time or near-real-time GPS system, these outliers might be interpreted as significant motion of the DAM2 station. For this reason, we attempt to identify parameters generated by the GAMIT/GLOBK
46、 processing that might be used to flag poor solutions.During our initial analysis of two years daily solutions (Hudnut & Behr, 1998) we suspected that the lack of data from one or more regional GPS stations (ROCK, CHIL or LEEP) might weaken the quality of the network solution. We were concerned that
47、 the small aperture dam network would require distant sites to strengthen the network geometry. In that analysis all stations except DAM1 and DAM2 had coordinates constrained to 1-1-5 cm (NEU), while orbits and earth orientation parameters were loosely constrained. In essence, we were relying more o
48、n our regional station coordinates to define the reference frame. However, we found no relationship between missing regional data and outliers in the 24-hour solutions. Instead, we observed a relationship between low numbers of double difference observations and outlier occurrence. Figure 4. Outlier
49、 rejection results for the DAM1-DAM2 E-W baseline. Data extracted from the GAMIT/GLOBK solutions (top frame) have several extreme outliers removed via the double difference technique (middle). Little or no improvement was made in the application of the chi-square test so the remaining outliers were
50、removed in a first-difference cut (bottom).In the present treatment, our solutions have 75% fewer double differences because of the switch to quarter-day sessions while still processing at a 120-s sampling interval. Nevertheless, the low double-difference technique was again applied. We compiled 3-y
51、ear time series of the number of double difference observations for each station for each 6-hour session and calculated mean values for each series. If either one of the baseline end-points provided less than 75% of mean values, we delete that session from all baseline time series involving that sta
52、tion. This succeeded in removing several outliers (Figure 4, Table 3) though it was less successful than its application to the 24-hour solutions.We investigated a second rejection test by examining the values of the GLOBK chi-square per degree of freedom for each independent solution. As stated abo
53、ve, we use GLOBK to analyze each solution independently and to identify and reject sessions that exceed a configurable chi-square cutoff parameter, here set to 10.0. This cutoff may have been too high. Chi-square per degree of freedom should fall around 1.0 if the data have been weighted properly. W
54、e reexamined the GLOBK estimates and flagged solutions that had chi-square per degree of freedom 3. Although 25 solutions were tagged and removed, the Pacoima Dam time series cleaned by this method did not show significant decrease in the number of outliers. One probable failure with this technique
55、is that the chi-square value is determined for all data in a solution and is not a site-specific parameter. This may lead to the rejection of high-quality data from the Pacoima Dam network when the problem data may have been from a regional station. At this point, we do not favor secondary removal o
56、f data based on high chi-square per degree of freedom.Table 3. Baseline estimates after each cleaning stage.BaselineGAMIT/GLOBKLow DDHigh Chi2First Diff.%CMP9-DAM1391138693847379089CMP9-DAM2389338863862381090DAM1-DAM2383137893767373188% is the total sessions out of a possible 4236 (1059 days, 4 sess
57、ions/day)We have not yet found a satisfactory method for rigorous identification and removal of all outliers in the Pacoima Dam time series. Although the identification of low numbers of double differences holds promise for application in a near-real-time continuous GPS monitoring system, other meth
58、ods for flagging poor quasi-observations need to be determined. While systematic techniques for complete outlier removal have not been identified, in order to continue with the analysis of DAM2 motion we forced the removal of the remaining bad data. A first-difference (rate-of-change) time series wa
59、s calculated for each component of the three baselines. The mean and standard deviation were then calculated for each component and all data points greater than 3-standard deviations from the mean were removed. Gaps in the time series were then filled using a linear interpolant (cubic and Akima spli
60、nes were tested but introduced significant structure into the time series and were deemed inaccurate). This data set was used for the analysis of the deformation at Pacoima Dam.The final, cleaned and adjusted DAM1-DAM2 time series are displayed in Figure 5. Although there is evidence that station DA
61、M1 experiences annual displacement of a few mm opposite in trend to the motion of DAM2, we restrict our analysis to the dominant motion of the center of the dam arch. This is justifiable because of the lower uncertainties associated with the short DAM1-DAM2 baseline, and because of the existence of
62、higher than average systematic noise in the data recorded at CMP9. This baseline focuses the deformation analysis along a segment of the dam that experienced troubling damage during the Northridge earthquake, extension and fracturing of the downstream faade at the left abutment/thrust block contact.
63、 Before analyzing recent deformation on this baseline, we examine the nature and the quality of the quarter-day baseline estimates.Figure 5. Final DAM1-DAM2 baseline time series, Sept. 1, 1995 through July 26, 1998. Time series have had outliers removed via double-difference, chi-square and first-di
64、fference techniques. SUB-DAILY SOLUTIONSDuring our analysis of the baseline time series power spectral density, we observed a surprising amount of power at the Nyquist frequency (2 cycles per day). It was an immediate concern that we were aliasing a high-frequency signal in the quarter-day solutions
65、 that had been averaged out in the daily solutions (Figure 6, frame 1). We observed in the E-W component of the DAM1-DAM2 quarter-day time series a repetitive displacement pattern in which the quarter-daily estimates varied by 2-3 mm from the daily position estimates. Aware of the thermoelastic response of the dam, we first looked for a correlation using sub-hourly temper
- 温馨提示:
1: 本站所有资源如无特殊说明,都需要本地电脑安装OFFICE2007和PDF阅读器。图纸软件为CAD,CAXA,PROE,UG,SolidWorks等.压缩文件请下载最新的WinRAR软件解压。
2: 本站的文档不包含任何第三方提供的附件图纸等,如果需要附件,请联系上传者。文件的所有权益归上传用户所有。
3.本站RAR压缩包中若带图纸,网页内容里面会有图纸预览,若没有图纸预览就没有图纸。
4. 未经权益所有人同意不得将文件中的内容挪作商业或盈利用途。
5. 装配图网仅提供信息存储空间,仅对用户上传内容的表现方式做保护处理,对用户上传分享的文档内容本身不做任何修改或编辑,并不能对任何下载内容负责。
6. 下载文件中如有侵权或不适当内容,请与我们联系,我们立即纠正。
7. 本站不保证下载资源的准确性、安全性和完整性, 同时也不承担用户因使用这些下载资源对自己和他人造成任何形式的伤害或损失。
